Figure 3.
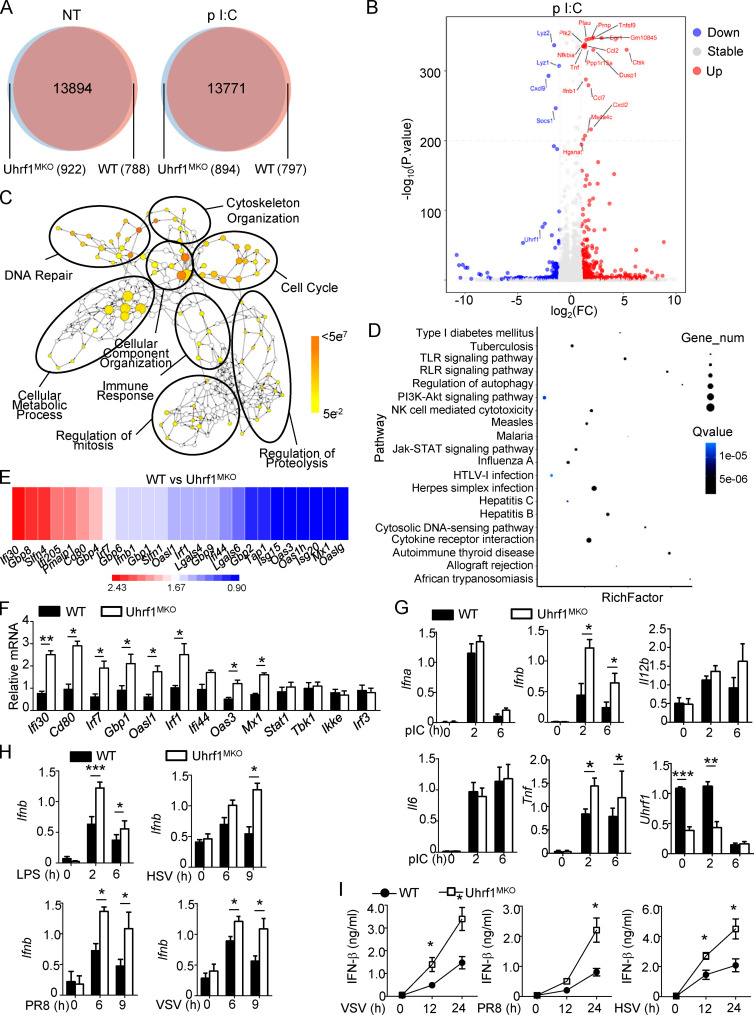
Uhrf1 deficiency causes specific upregulation of IFN-I and ISGs. (A and B) Venn diagrams (A) and volcano graphs (B) illustrating the overlap of DEGs between WT and Uhrf1-deficient BMDMs stimulated with 20 µg/ml pI:C for 2 h. FC, fold change; NT, nontreatment. (C) Network visualization of gene ontology enrichment analysis of DEGs in Uhrf-deficient BMDMs in response to pI:C for 2 h. (D) KEGG analysis of these DEGs in Uhrf1-deficient BMDMs indicated pathways that differed significantly (in abundance). RLR, RIG-I–like receptor. (E and F) Heat map (E) and qPCR analysis (F) showing ISG expression in Uhrf1-deficient cells activated by pI:C for 2 h (n = 3). (G) qRT-PCR analysis of the indicated genes using WT or Uhrf1-deficient BMDMs stimulated with pI:C (n = 6). (H) The mRNA levels of Ifnb induced by different viruses in WT and Uhrf1-deficient BMDMs were measured by qPCR (n = 6). (I) ELISAs of IFN-β in the supernatants of WT or Uhrf1-deficient BMDMs stimulated with specific viruses (n = 3). All the data are representative of at least three independent experiments. The data from the qPCR assay are presented as fold changes relative to the actin mRNA levels. The data are presented as means ± SEMs. The significance of differences was determined by a t test. *, P < 0.05; **, P < 0.01; ***, P < 0.005.

