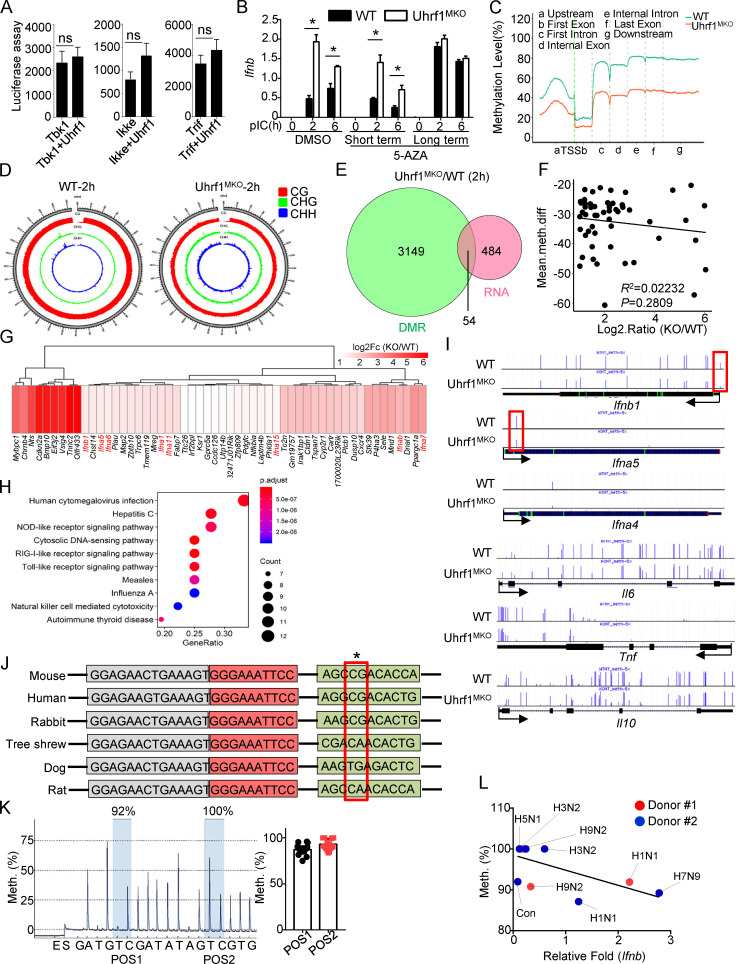
Figure 5.
Uhrf1 deficiency removes the methylation on the Ifnb promoter. (A) HEK293T cells were transfected with an Ifnb-luciferase reporter plasmid in the presence or absence of the indicated Uhrf1 expression plasmids (n = 4). Luciferase assays were performed, and the data are expressed as fold changes based on the empty vector group 36 h after transfection. (B) BM cells were incubated with 1 µM 5-AZA for 5 d (long). Differentiated macrophages were incubated with 1 µM 5-AZA for 24 h (short). The mRNA levels of Ifnb induced by pI:C in 5-AZA–pretreated WT and Uhrf1-deficient BMDMs were measured by qPCR (n = 5). (C) Methylation level (percentage) in the genomes of WT and Uhrf1-deficient BMDMs with the gene features of interest, including the gene body (all exons and introns), promoter, first exon, first intron, the rest of the exons, and the rest of the introns. (D) Epigenome density plot for CG, CHG, and CHH methylation contexts in chromosome 4 from WT and Uhrf1-deficient BMDMs. (E and F) Venn diagrams illustrating the overlap of DEGs whose promoters exhibited significant demethylation in pI:C-stimulated Uhrf1-deficient BMDMs (E), and correlation between the expression of these DEGs and methylation level on their promoter (F). (G and H) Heat map and KEGG analysis of these overlapping DEGs selected as above. (I) Genome Browser snapshots of the DNA methylation levels near Ifnb and other proinflammatory cytokine promoters in mice. (J) Sequence alignment of single-nucleotide methylated sites on Ifnb promoters of different species. The red box indicates the methylated site. (K) Pyrosequencing graphic results of the methylation levels of the Ifnb promoter region. The ratio of thymine (T) to cytosine (C) at each CpG position (gray) to determine the percentage of DNA methylation (n = 17). (L) Correlation between Ifnb and the methylation level on its promoter in PBMCs from healthy donors infected with different strains of the influenza virus. The data from the qPCR assay are presented as fold changes relative to the actin mRNA levels. All the data are representative of at least three independent experiments. The data are presented as means ± SEMs. The significance of differences was determined by a t test. *, P < 0.05.

