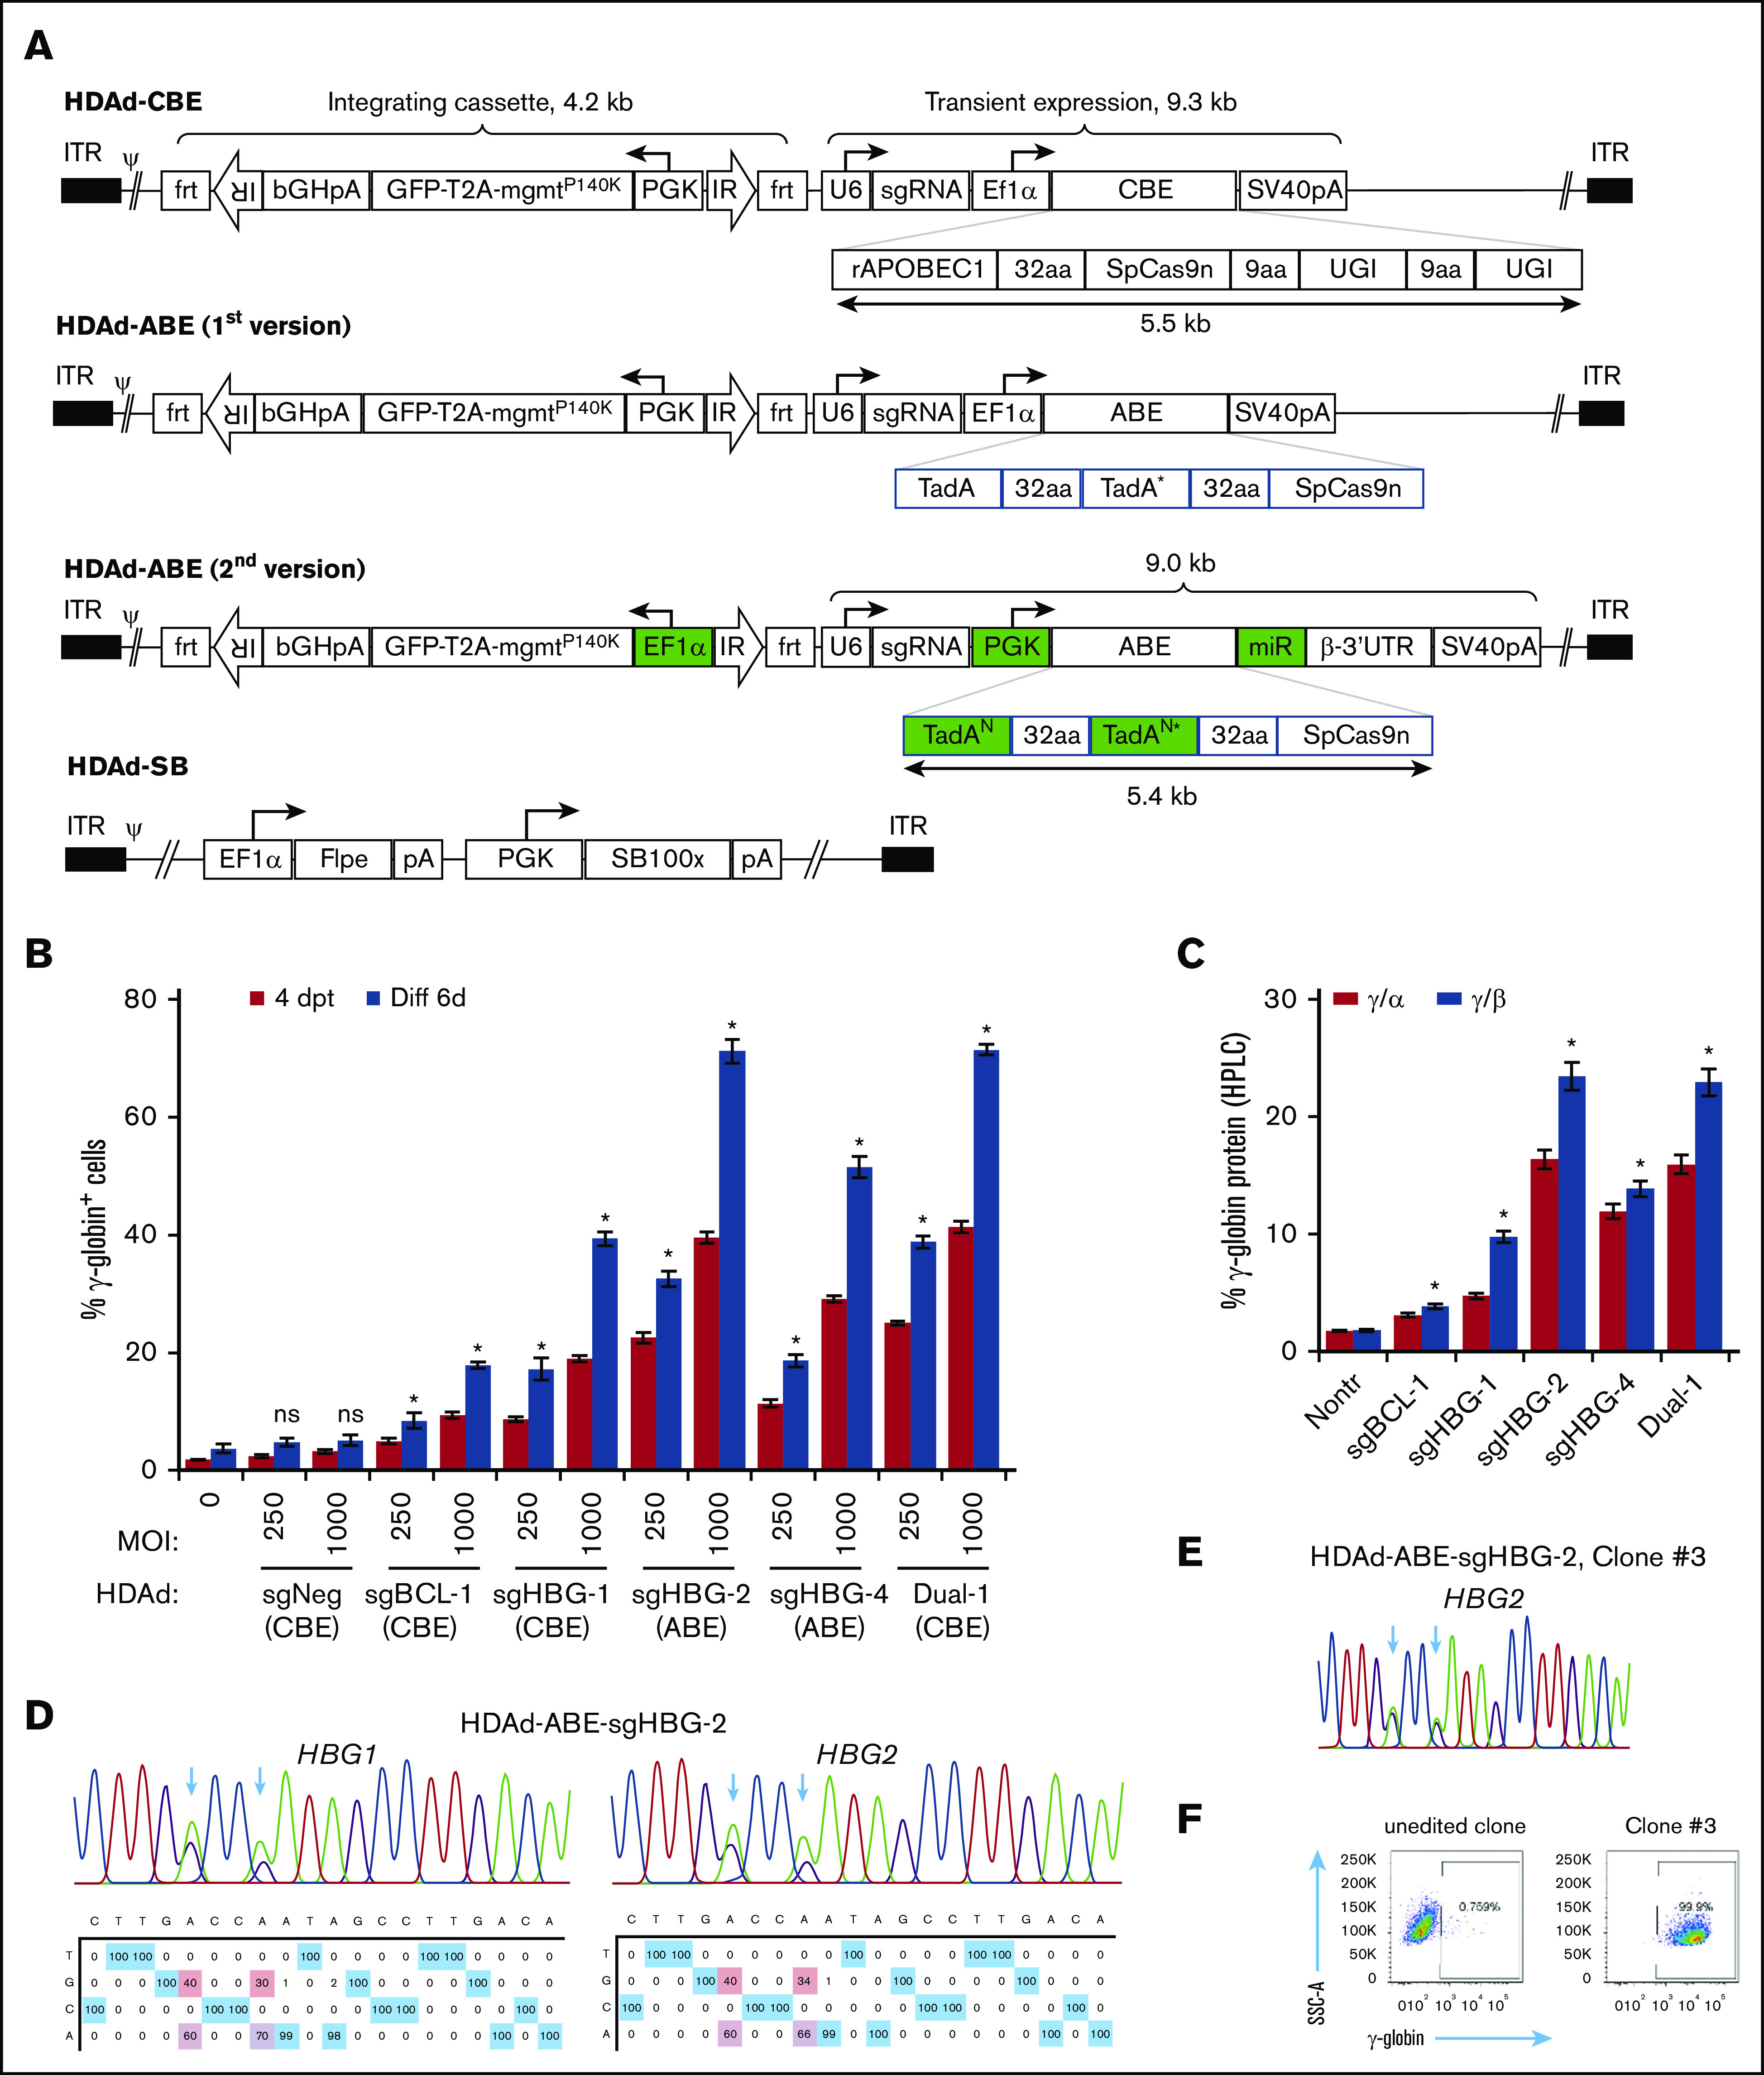
Figure 2.

Construction and validation of HDAd-BE vectors. (A) Diagrams of HDAd vectors. The overall structure of HDAd-CBE/ABE vectors contains an mgmtP140K/GFP transposon (4.2 kb) flanked by 2 frt-IRs and a BE cassette (∼9 kb). The transposon allows for integrated expression when codelivered with HDAd-SB expressing SB100× transposase and flippase (Flpe). The BE cassette was placed outside of the transposon for transient expression. The first version of HDAd-ABE vectors was not producible. The second version of HDAd-ABE vector design contains 2 codon-optimized TadAN repeats to reduce sequence repetitiveness (N, new; *, the catalytic repeat). An mi-RNA–responsive element (miR) was embedded in the 3′ human β-globin untranslated region to minimize toxicity to producer cells by specifically downregulating ABE expression in 116 cells. 32aa or 9aa, linker with 32 or 9 amino acids; ψ, packaging signal; bGHpA, bovine growth hormone polyadenylation sequence; ITR, inverted terminal repeat; PGK, human PGK promoter; rAPOBEC1, cytidine deaminase enzyme; SpCas9n, SpCas9 nickase; SV40pA, simian virus 40 polyadenylation signal; T2A, a self-cleaving 2A peptide; TadA, adenosine deaminase; U6, human U6 promoter; and UGI, uracil glycosylase inhibitor. (B) γ-Globin induction in HUDEP-2 cells after transduction with HDAd vectors. Cells were transduced with various vectors at MOIs of 250 and 1000 vp per cell. The γ-globin expression was measured by flow cytometry 4 days after transfection (4dpt) and 6 days after in vitro erythroid differentiation (Diff 6d). A CBE vector targeting the CCR5 coding region was included as a negative control (sgNeg). Data shown are the mean ± SD of 3 biological replicates. (C) Percentage of γ-globin expression over α- or β-globin measured by HPLC at day 6 after differentiation. MOI of 1000 vp per cell. Data shown are the mean ± SD of 3 biological replicates. (D) Representative target base conversion by HDAd-ABE-sgHBG-2. HBG1 or HBG2 genomic segments encompassing the targeting bases were amplified and subjected to Sanger sequencing. Data were analyzed by EditR1.0.9. The arrows indicate targeted bases. The percentage of conversions are shown below the chromatograms. (E-F) A representative clone (#3) derived from HUDEP-2 cells transduced with HDAd-ABE-sgHBG-2. Monoallelic –113 and –116A>G base conversions were detected in the HBG1 promoter (E), resulting in 100% γ-globin+ cells detected by flow cytometry (F). *P < .05; ns, not significant (compared with nontransduced samples).
