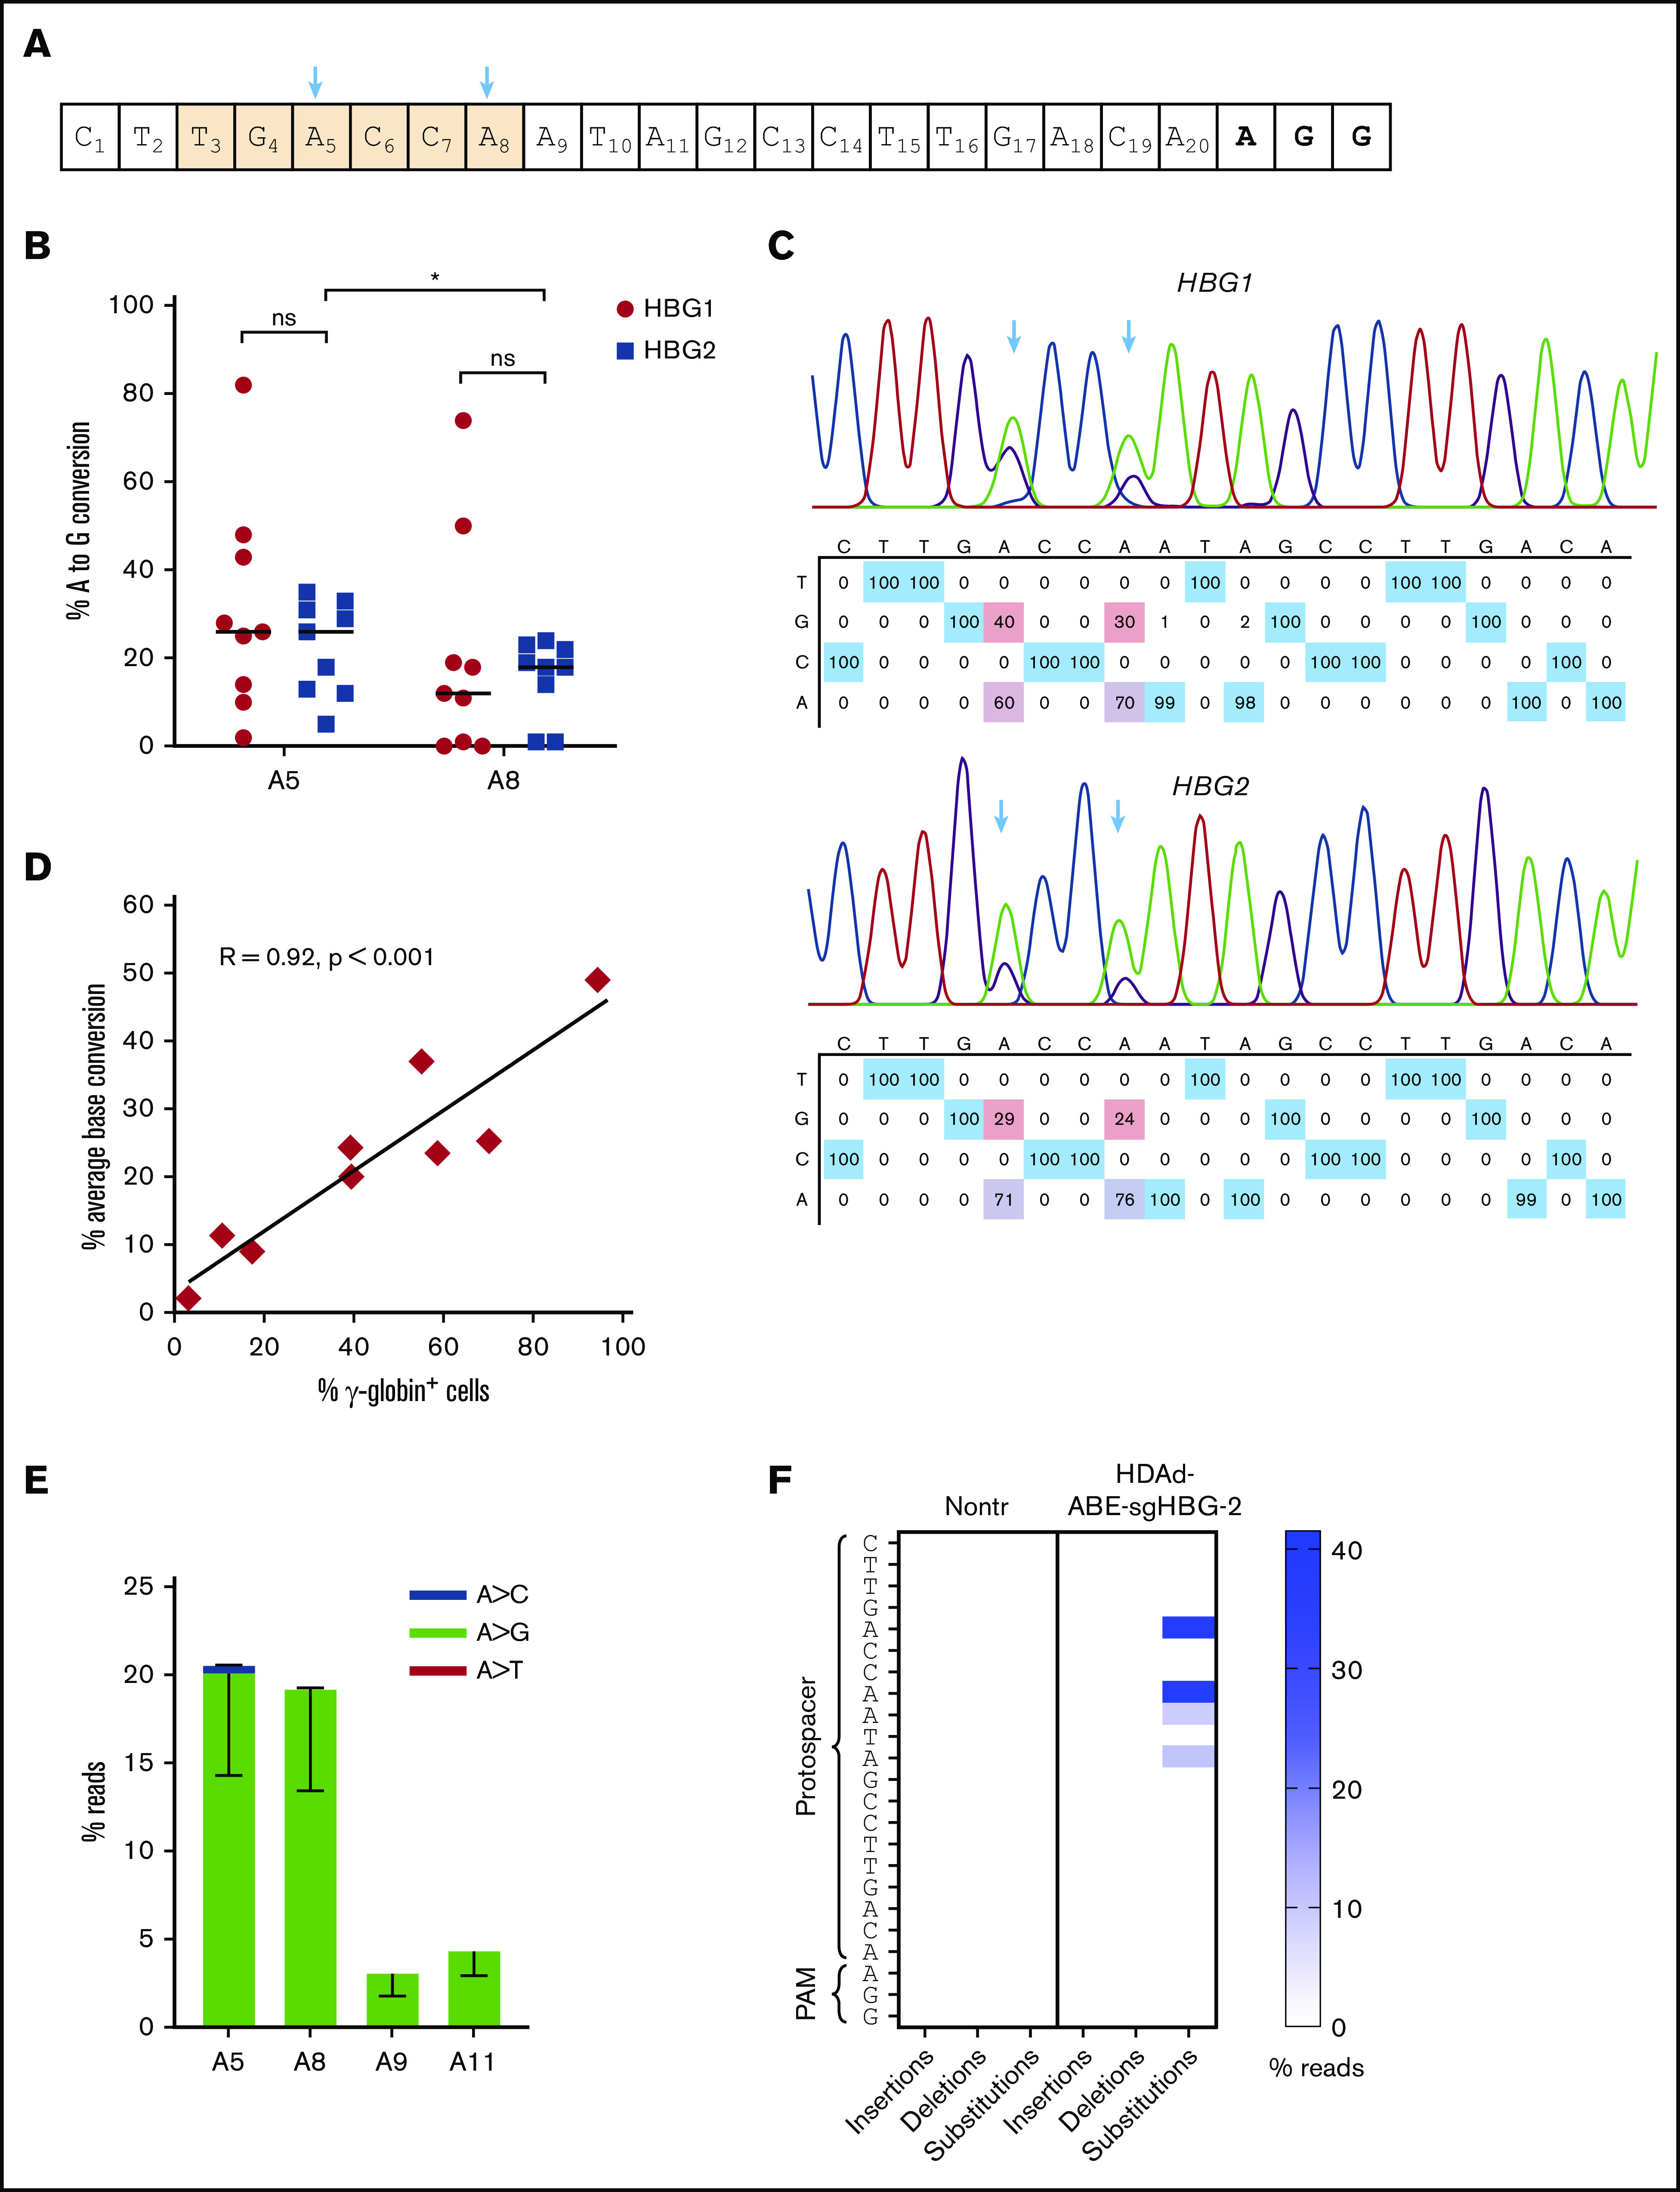
Figure 4.

Target base conversion after in vivo HSPC transduction of β-YAC mice with HDAd-BE vectors. (A) sgHBG-2 guide sequence. The numbering starts from the 5′ end. Highlighted in orange is the TGACCA motif, a reported BCL11A binding site within the HBG1/2 promoters. The 2 adenines (A5 and A8) in the motif are indicated by arrows. (B) Percentage of target base conversion in total bone marrow mononuclear cells by Sanger sequencing. Both A5 and A8 in HBG1 and HBG2 promoter regions are shown. Each symbol represents 1 animal (n = 9). (C) Representative sequencing results showing target base conversion in HBG1 and HBG2 region of the #1369 mouse. (D) Correlation between average base conversions and γ-globin expression. The percentage of average base conversion in each animal was the average level at A5 and A8 in HBG1 and HBG2 promoter regions. Each symbol represents 1 animal (n = 9). A Person test was performed (R = 0.92; P < .001). (E) Substitution frequencies detected by NGS; n = 5). (F) Frequency of insertions, deletions, and substitutions in mouse #1369 measured by NGS and analyzed by CRISPResso2. *P < .05. ns, not significant.
