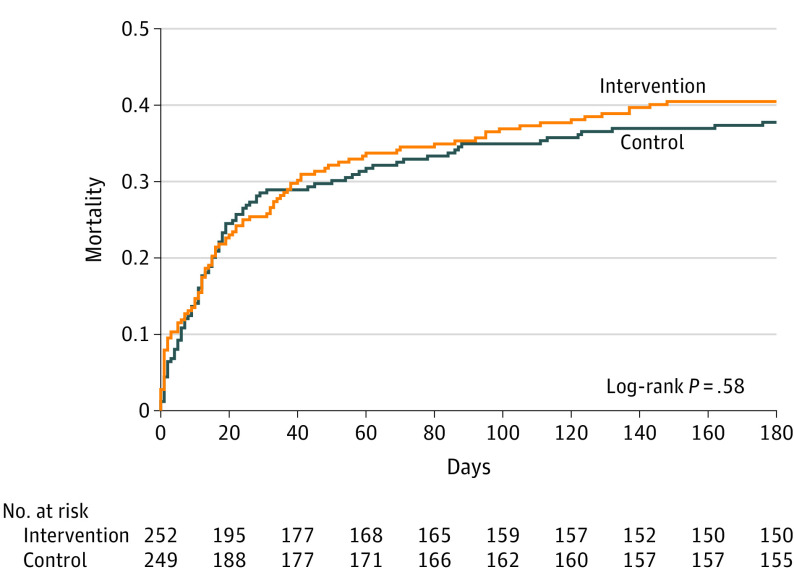
Figure 2. Survival in the Intervention and Control Groups at 180 Days.
Cumulative deaths for the 180-day follow-up period are shown. Median time to death in the intervention group was 16 (interquartile range, 4-41) days and in the control group was 15 (interquartile range, 6-29) days. The proportionality P = .81, suggesting that the proportionality assumption was met.

