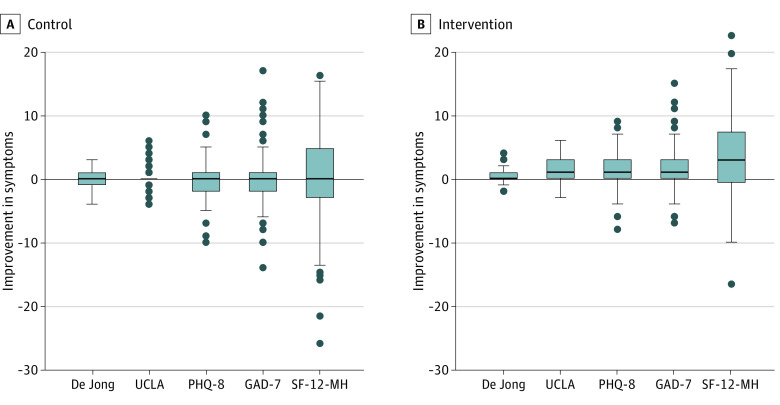
Figure 2. Box Plots of Changes in Loneliness, Depression, Anxiety, and General Mental Health Over 4 Weeks in the Intervention and Control Arms.
Box plot indicates median, interquartile range, and lower and upper adjacent values. De Jong indicates De Jong Giervald Loneliness Scale; GAD-7, Generalized Anxiety Disorder scale; PHQ-8, Personal Health Questionnaire for Depression; SF-12-MH, Short Form Health Survey Questionnaire Mental Health; UCLA, UCLA Loneliness Scale.

