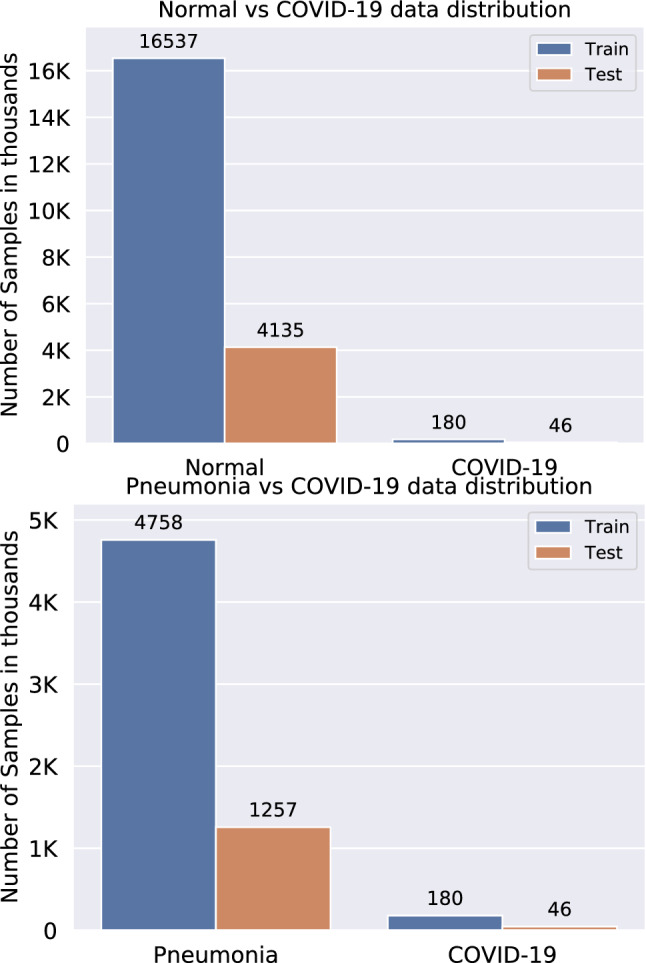
Fig. 3.

Data distributions of Normal vs. COVID-19 (top) and Pneumonia vs. COVID-19 (bottom) with skew ratios of 91.87 and 22.9, respectively

Data distributions of Normal vs. COVID-19 (top) and Pneumonia vs. COVID-19 (bottom) with skew ratios of 91.87 and 22.9, respectively