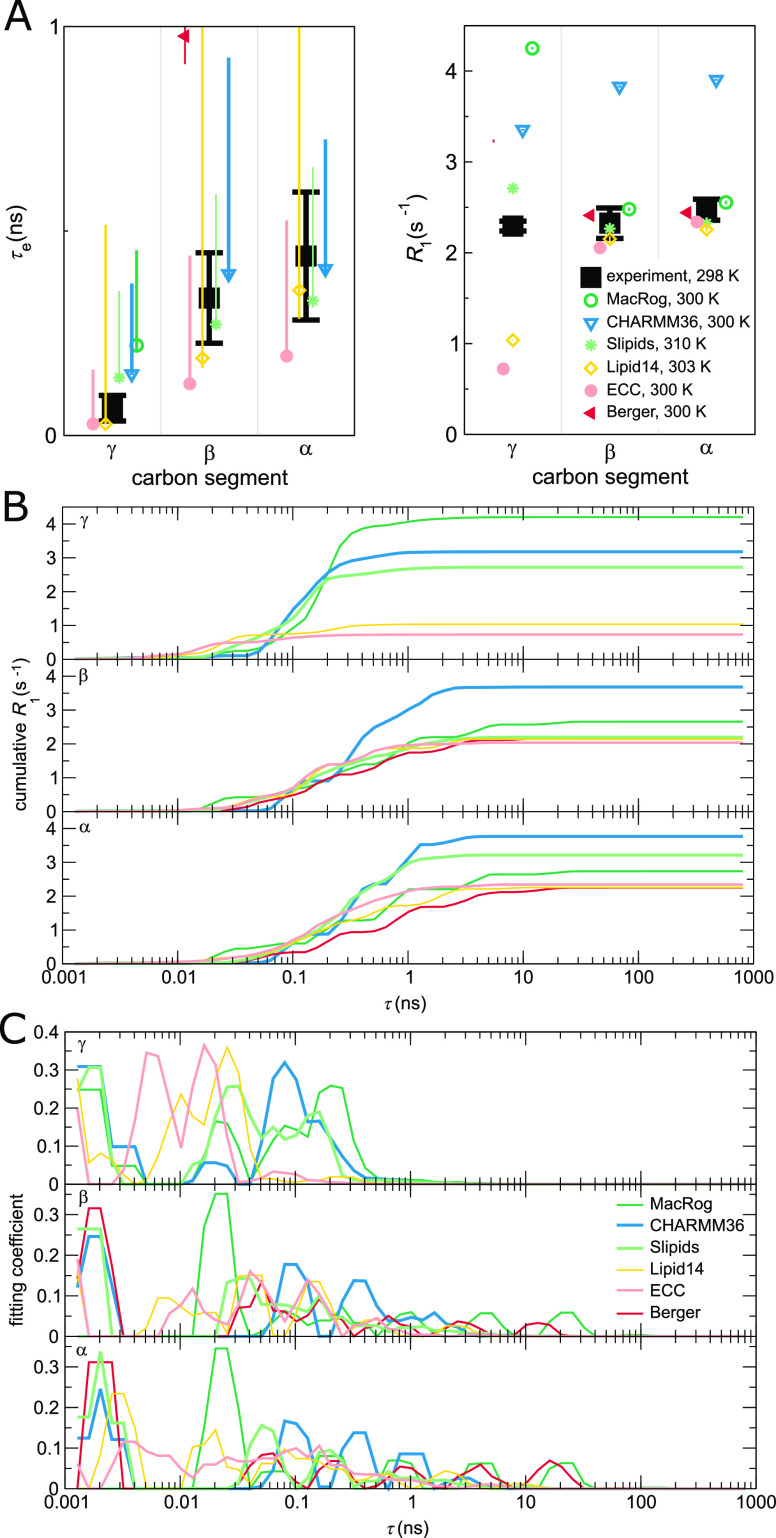
Figure 4.
Contributions to the dynamics of the headgroup segments. (A) Zoom on the headgroup τe (left panel) and R1 (right). (B) “Cumulative” R1(τ) of the γ (top panel), β (middle), and α (bottom) segments. R1(τ) is obtained, as detailed in Methods, by including in the sum of eq 12 only terms with τi < τ. Consequently, at τ → ∞, the R1(τ) approaches the actual R1. (C) Prefactor weights αi from eq 11 of γ (top), β (middle), and α (bottom). Note that panels (B) and (C) show a sliding average over three neighboring data points.

