
Figure 1.
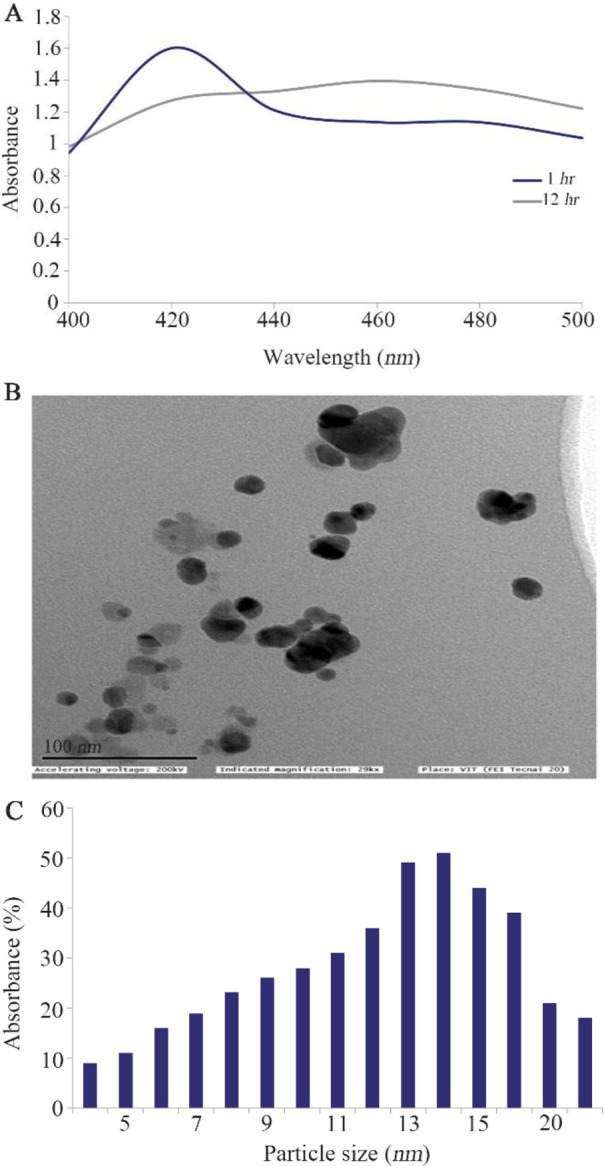
Synthesis and characterization of AgNP using sitosterol. A) UV-vis spectroscopic spectrum of AgNP. B) TEM image of AgNP. C) Histogram shows the size distribution of nanoparticles. ImageJ software was used to measure different sizes of nanoparticles.