Figure 3.
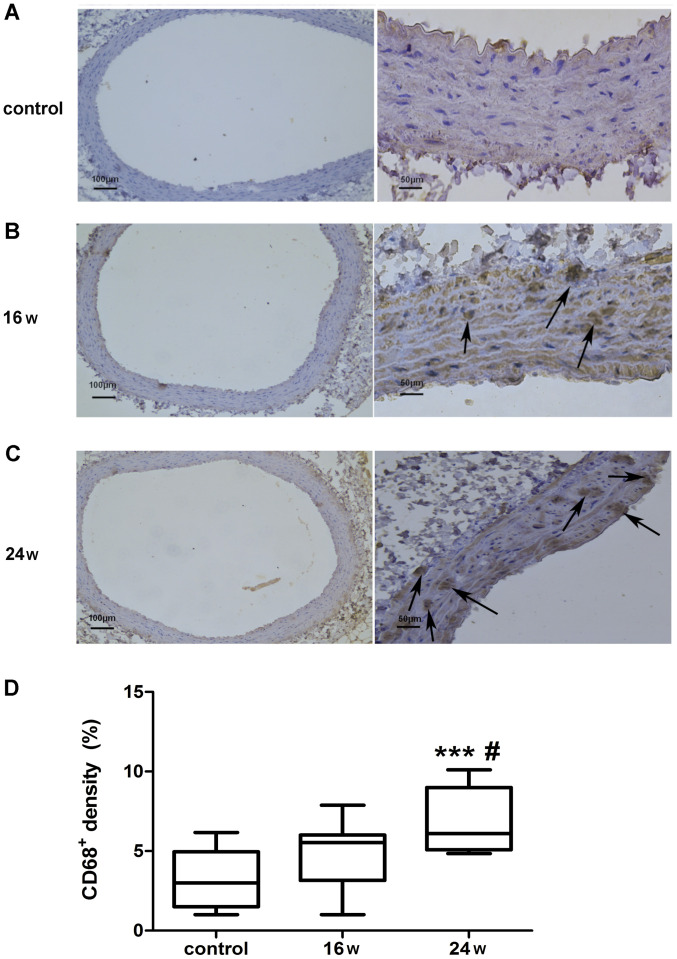
Expression of CD68-positive macrophages in the rat abdominal aortic wall. Immunohistochemical analysis of rat abdominal aortic vascular specimens, which were stained with CD68; the mean intensity of CD68 staining was analyzed. Arrows indicate the CD68+ cells. (A) Normal diet group at 24 weeks; (B) high-fat diet group at 16 weeks; (C) high-fat diet group at 24 weeks. (D) Percentage of CD68-positive cells in the total number of cells per unit area in each group were quantified: 3.20±1.72% for (A); 4.70±1.92% for (B); 6.93±1.93% for (C). Scale bars, 100 µm (left); 50 µm (right). Data are presented as the mean ± SEM. ***P<0.001 vs. the normal diet (control) group; #P<0.05 vs. the 16-week group.

