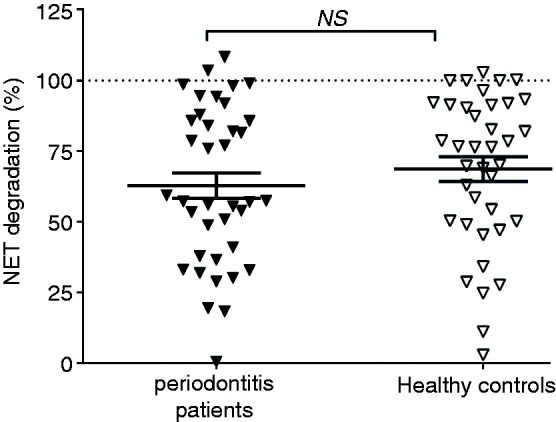
Figure 2.

NET degradation by plasma from periodontitis patients and healthy controls. NET degradation levels of periodontitis patients (n=38) and healthy controls (n=38). Each individual data point represents the mean of three independent experiments from one plasma sample. Horizontal lines represent the overall mean percentages ± SEM. NS: not significant.
