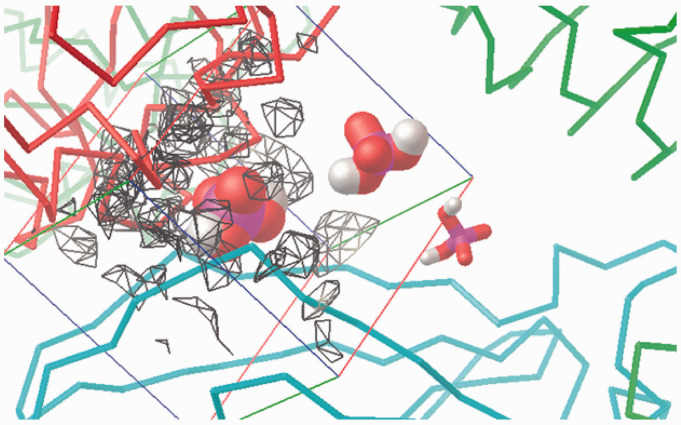
Figure 10.
Visualisation of the –1 charge attraction fields from residues in the murine wedge calculated by AD4 (for a 40 Å×40 Å×40 Å box). TLR4 (green ribbons, right), counter TLR4* (red ribbons, left) and MD-2 (light blue ribbons, bottom) contour the broadly triangular cavity. The three sites are marked with a H2PO4– mono-anion: Pan (VDW volume, left), PagPan (sticks, right) and Pag (half space-filled, top). The murine Pan site is almost completely engulfed in the negatively charged (q = –1) attraction fields (grey to black wire frames). The mono-anionic probe (q = –1) cannot approach and will make its way to the Pag site (top, midsection) which is completely free of negative electrostatic fields, that is, no wire frames contouring it. Compared to Figure 9, Pag lies way off the field lines (wire frames) on the top right corner of the box (top, almost centre).

