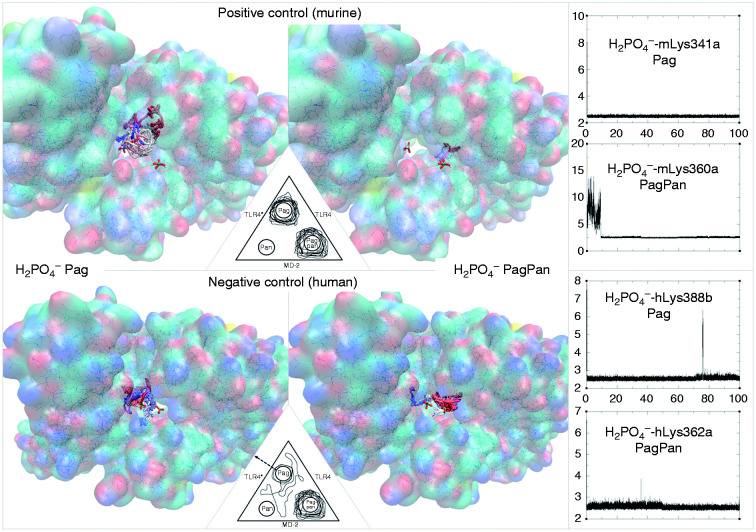
Figure 13.
Trajectories of phosphate mono-anion inside the murine (positive control, dimeric receptor, top) and human (negative control, monomeric receptor, bottom) wedge. Left: Trajectory for phosphate with start position at the Pag site. Centre: Trajectory for phosphate with the start position at the PagPan site. Right: Interaction distances plots (distance in Å on y-axes) in function of time (ns, x-axes) between phosphates and the wedge residues. Topmost plots: Phosphate interaction distances with murine wedge residues. Bottom most plots: Phosphate interaction distances with human wedge residues. Red line: trajectory during the first third. White line: trajectory during the second third. Blue line: trajectory during the last third. Each letter labels a species (h: human; m: mouse).

