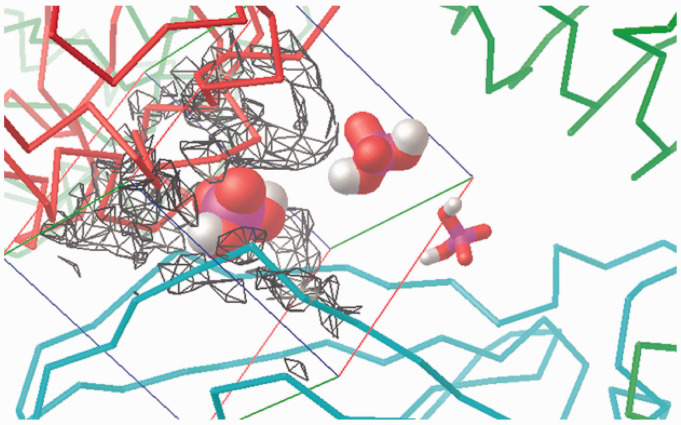
Figure 9.
Visualisation of the +1 charge attraction fields from residues in the murine wedge calculated by AD4 (for a 40 Å×40 Å×40 Å box). TLR4 (green ribbons, right), counter TLR4* (red ribbons, left) and MD-2 (light blue ribbons, bottom) contour the broadly triangular cavity. The three sites are marked with a H2PO4– mono-anion: Pan (VDW volume, left), PagPan (sticks, right) and Pag (half space-filled, top, midsection). The murine Pag site is under the influence of the positive net charge (q = +1) which visualises the strong attraction field (grey to black wire frames). The mono-anionic probe prefers the position marked by the phosphate model at Pag. The field lines (wire frames) were drawn only for q = +1, and lines for 0 < q < +1 would expand to reach the probe model at Pag, but such lines would hide the molecular structures from display.

