
Figure 4.
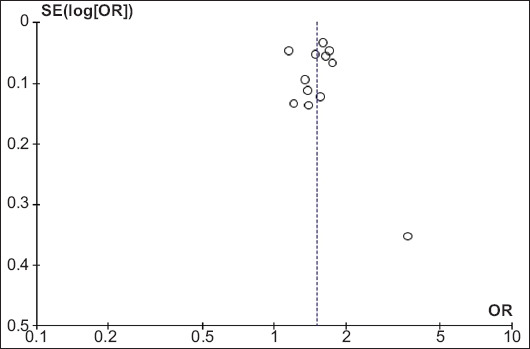
Funnel plot for bias analysis of studies included in the pooled estimation of adenoma detection rate
SE, standard error; OR, odds ratio
Official websites use .gov
A
.gov website belongs to an official
government organization in the United States.
Secure .gov websites use HTTPS
A lock (
) or https:// means you've safely
connected to the .gov website. Share sensitive
information only on official, secure websites.
Funnel plot for bias analysis of studies included in the pooled estimation of adenoma detection rate
SE, standard error; OR, odds ratio