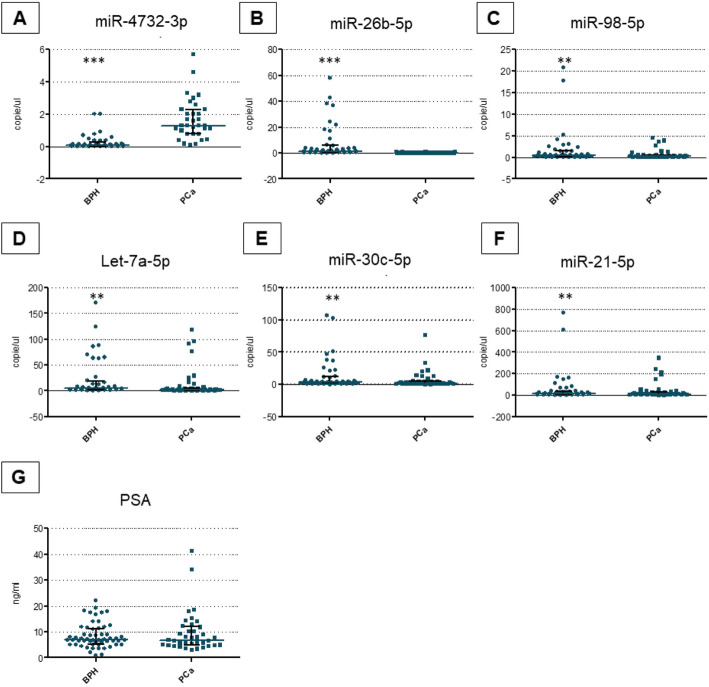
Fig. 2.
Differential levels of miRs and PSA in PCa patients versus controls in plasma samples from validation cohort 1. Abbreviations: PCA,Prostate Cancer; BPH,Benign prostate Hyperplasia; PSA,Prostate Specific Antigen. All data were expressed as copies/ μL of reaction or ng/ml as described. The horizontal blue line in the middle of each box indicates the median.Whereas the top and bottom black line 75th and 25th percentiles, respectively, Mann-Witney U test; ** indicates p value < 0.001; *** indicates p value < 0.0001; for all comparisons (BPH versus PCa)

