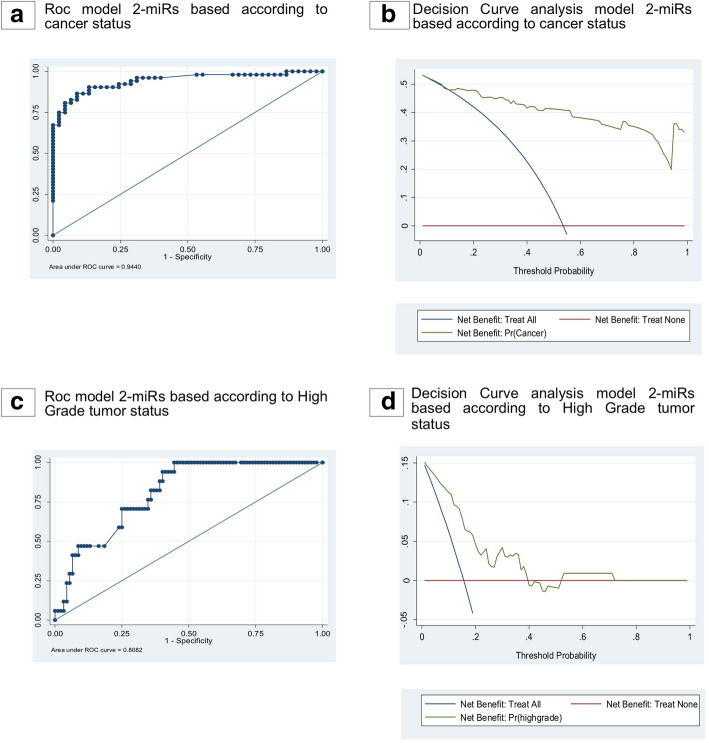
Fig. 6.
Decision Curve Analysis of the 2-miRs model in the Validation cohort 2. a. Roc model 2-miRs based according to cancer status in validation cohort 2. b. Decision curve analysis for the 2-miR model based according to cancer status in validation cohort 2. The straight red line at y = 0 represents a strategy of performing a biopsy in no patients and the blue line represents the strategy of performing a biopsy in all patietns. The area of the graph for which a risk calculator has a greater net benefit than both the ‘biopsy none’ and ‘biopsy all lines is where it has greatest clinical applicability. c. Roc model 2-miRs based according to High grade tumor status in validation cohort 2. d. Decision curve analysis for the 2-miRs model based according to grade tumor status in validation cohort 2. The straight red line at y = 0 represents a strategy of performing a biopsy in no patients and the blue line represents the strategy of performing a biopsy in all patietns. The area of the graph for which a risk calculator has a greater net benefit than both the ‘biopsy none’ and ‘biopsy all lines is where it has greatest clinical applicability

