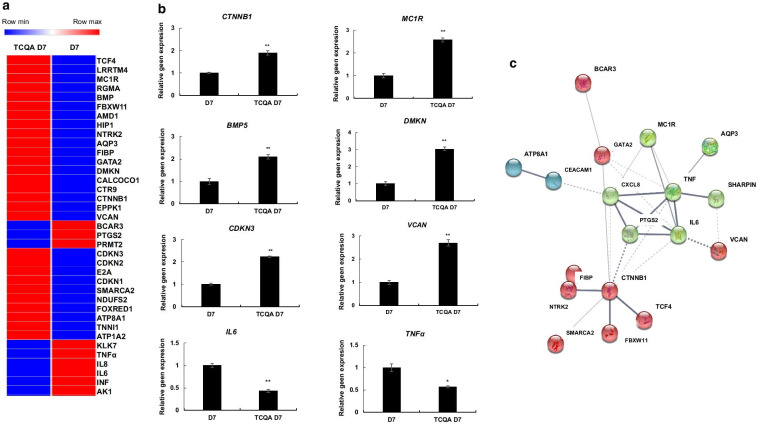
Fig. 4.
Molecular functions induced in D7 TCQA-treated compared with D7 control hAECs. a Heat map showing relative expression intensities of DEGs. Heat map was generated using Morpheus software. b Gene expression of CTNNB1, MC1R, VCAN, DMKN, IL6, and TNFα in D7 TCQA-treated and D7 control hAECs. The mRNA level was quantified using TaqMan real-time PCR. Results represent the mean ± SD of three independent experiments. The Student’s t-test was used to compare the mean values of two groups. *P ≤ 0.05; **P ≤ 0.01. c Possible protein interactions among the genes classified in the heat map. Figure was generated using an online software STRING (https://string-db.org/)

