Fig. 4.
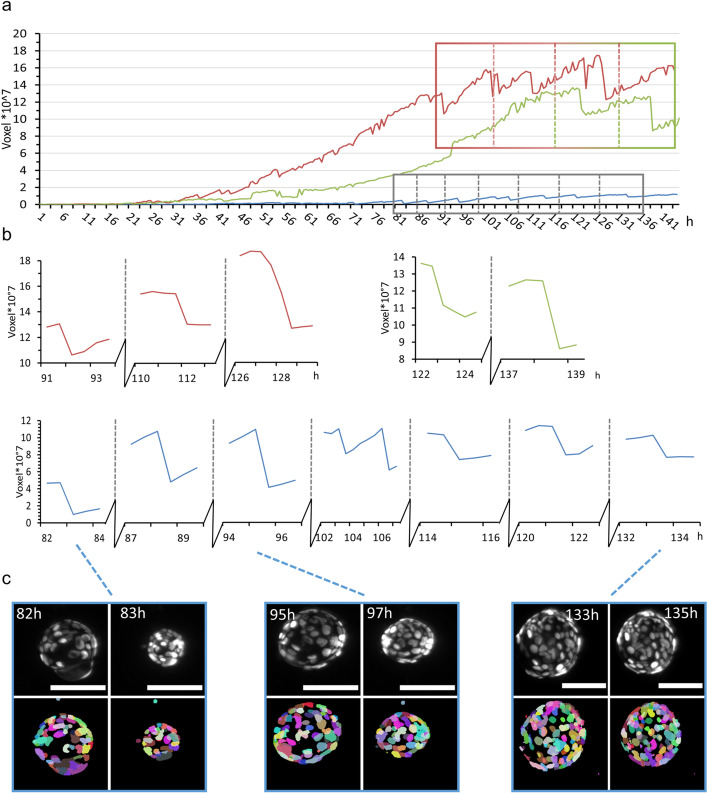
Volume analysis of three representative mPOs reveals different oscillation frequencies. MPOs (seeded and maintained in one Z1-FEP-cuvettes) expressed the nuclei marker Rosa26-nTnG (grey). Organoids were imaged for 6 days and three representative organoids were analysed with our previously published nuclei segmentation pipeline [22] in regard to size oscillation events. A size oscillation lasts between 30 min and 2 h. a Volume over time for each organoid approximated from the cell nuclei segmentation. b Close-up of three (red), two (green) and seven (blue) size oscillation events with more than 5% volume reductions are shown. c Typical images of organoid size oscillation. The upper row shows the nuclei in grey in the raw image, the lower row the segmented cell nuclei. Each colour illustrates a single-cell nucleus. Microscope: Zeiss Lightsheet Z.1; objective lenses: detection: W Plan-Apochromat × 20/1.0, illumination: Zeiss LSFM × 10/0.2; laser lines: 561 nm; filters: laser block filter (LBF) 405/488/561; voxel size: 1.02 × 1.02 × 2.00 μm3; recording interval: 30 min; scale bar: 100 μm

