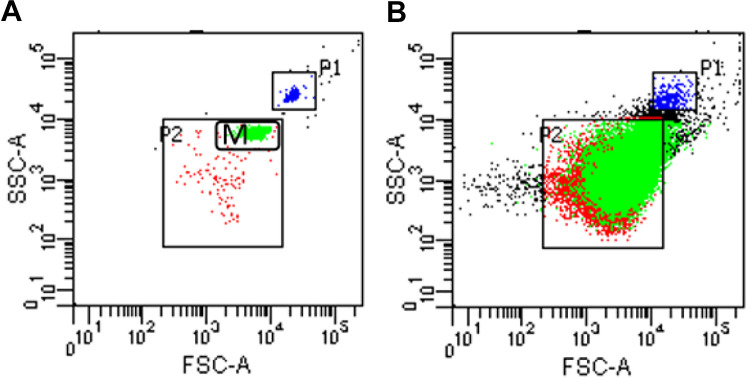
Figure 1.
The setting of gates in the flow cytometer is shown in Figure 1. The P1 gate and the M gate in Figure 1-A represent the positions of particles with diameters of 2 µm and 1 µm, respectively, and P2 is the position of particles with diameters of 0.1-1 µm, that is, the position of the MPs. Figure 1-B shows the flow diagram of MPs; most MPs are in the P2 gate.

