Figure 2.
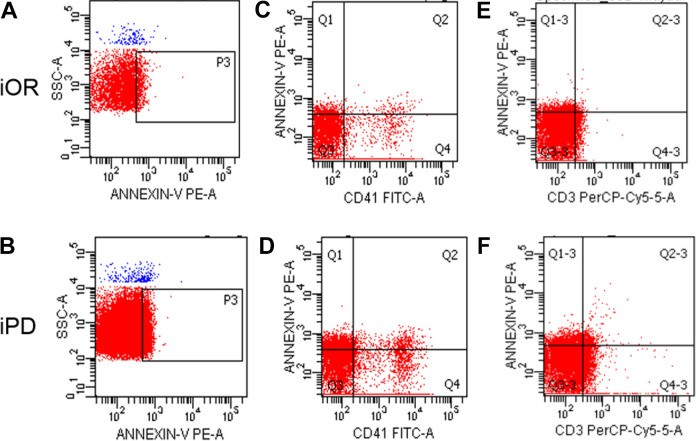
Flow chart of the expression levels of total MPs, PMPs and T-LyMPs in the iOR and iPD groups. Figure 2–A and 2–B shows total MPs in iOR group and iPD group; Figure 2–C and 2–D shows PMPs in iOR group and iPD group; Figure 2–E and 2–F shows T-LyMPs in iOR group and iPD group.

