Fig. 5.
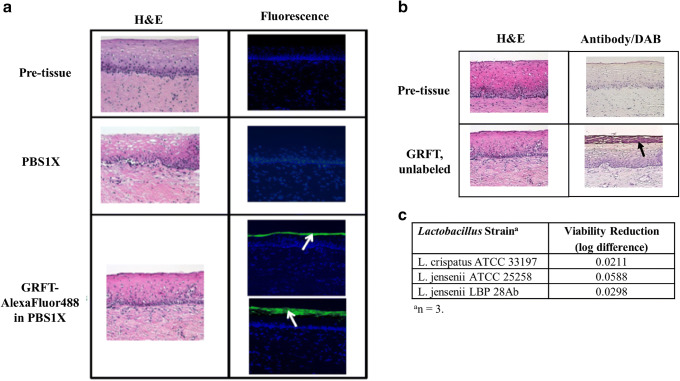
Cervical tissue microscopy of a GRFT-AlexaFluor488 and b unlabeled GRFT, and GRFT compatibility with lactobacilli (c). Representative H&E (first column) and fluorescence (FITC and DAPI filter overlay; second column) micrographs (a) or Antibody/DAB staining (second column) micrographs (b) are shown. GRFT tissue localization is represented by green fluorescence, as indicated by the white arrows (a) or by reddish-brown coloring, as indicated by the black arrow (b). Micrographs were taken with a × 20 objective for both a and b

