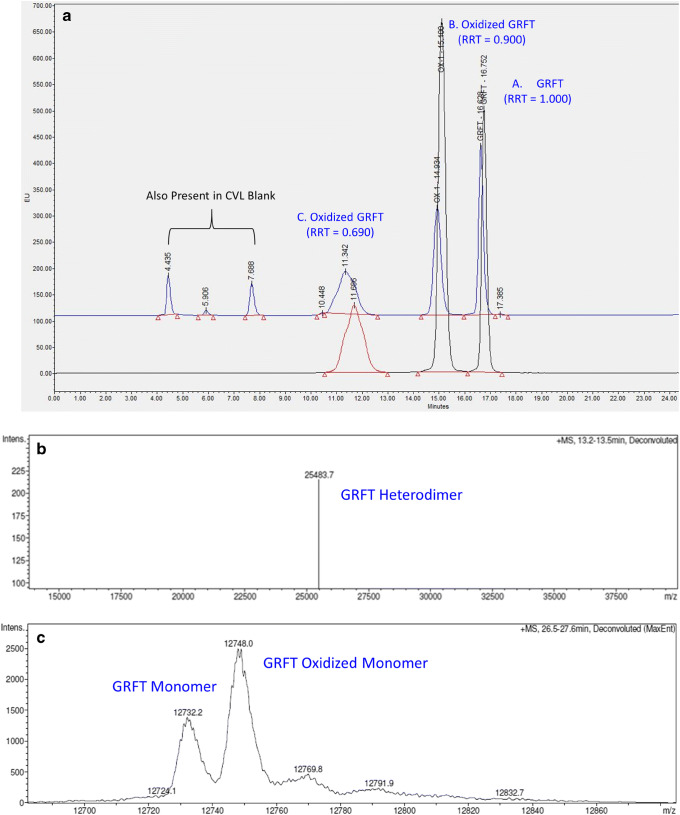
Fig. 6.
Oxidation of GRFT after exposure to 0.02% hydrogen peroxide (H2O2) and CVL. a Representative chromatograms and b–c representative intact masses observed after the exposure. HPLC chromatograms of GRFT exposed to H2O2 and human CVL (separately) are overlaid in order to visually compare the chromatographic similarity (a). The bottom (black line) chromatogram represents GRFT in 0.02% H2O2 at 5 h. The upper (blue line) chromatogram represents GRFT in human CVL at 2.5 h of exposure. Peak A is GRFT. Peaks B and C are oxidative products of GRFT. The extra peaks in CVL were also present in the CVL blank; therefore, they were not GRFT related. Mass spectrometric analysis of the H2O2 peak B identifies three species with intact masses corresponding to the heterodimer (b) and two monomers (c), respectively

