Fig. 4.


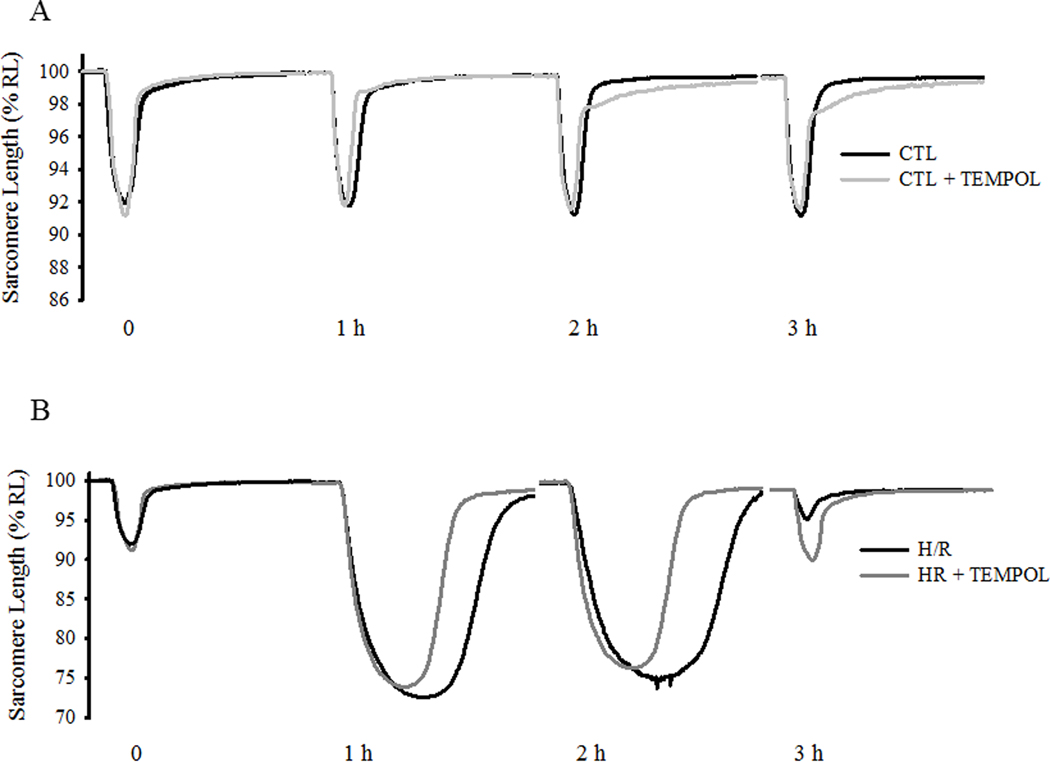
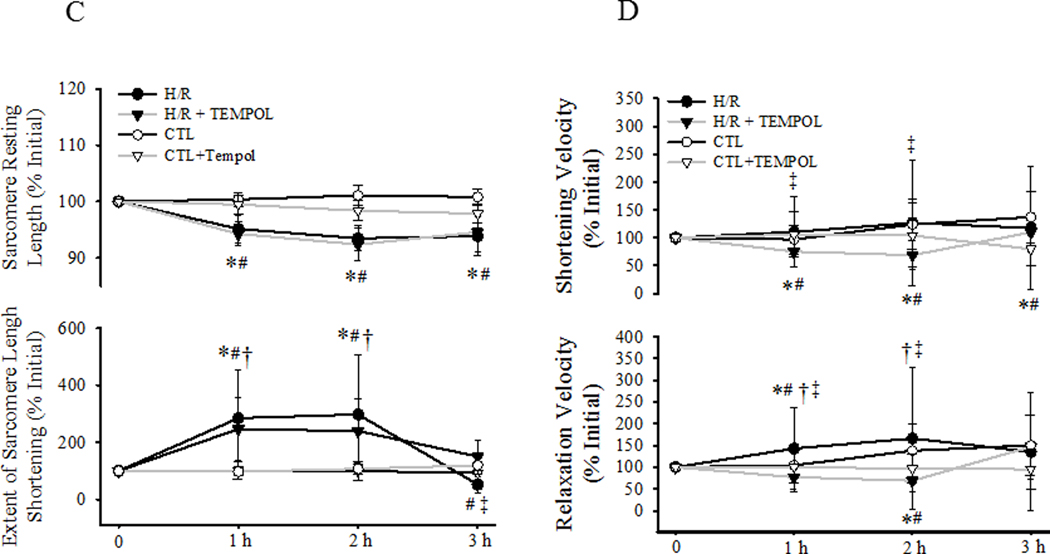
Contractile responses to electric field stimulation (0.5 Hz) of individual cardiomyocytes were measured under CTL (normothermic) and H/R conditions with and without concurrent TEMPOL treatment. Representative contractile responses of cardiomyocytes from CTL (±TEMPOL; A) and H/R (±TEMPOL; B) groups are shown and compared over time. Changes in initial resting sarcomere length (top) and the extent of sarcomere shortening (bottom) are shown in C. Changes in sarcomere shortening velocity (top) and relaxation velocity (bottom) are shown in D. Data are presented as means ± standard deviations. The number of cells used for each condition varied: CTL, n=22; CTL+TEMPOL, n=25; H/R, n=21; and H/R+TEMPOL, n=25. * P<0.05 vs initial value. # P<0.05 vs CTL, † P<0.05 vs CTL + TEMPOL, ‡ P<0.05 vs H/R + TEMPOL.
