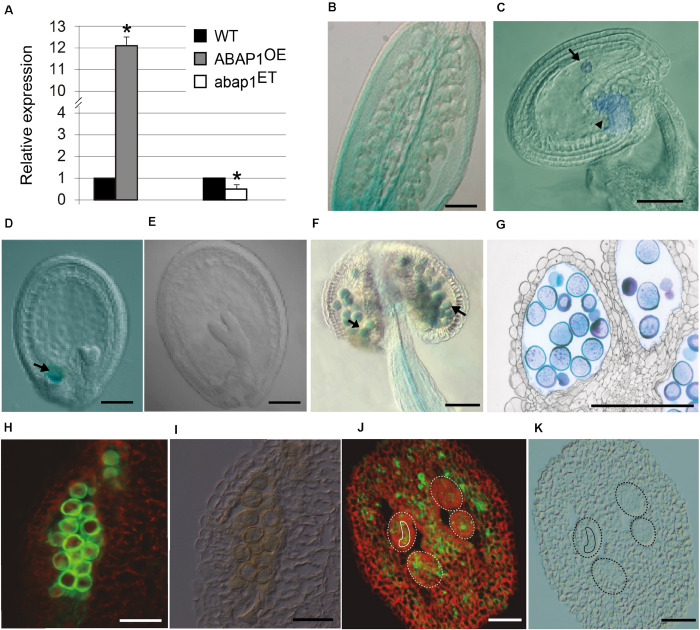
FIGURE 2.
ABAP1 expression in flowers. (A) Relative mRNA levels of ABAP1 were determined by qRT-PCR in wild-type, ABAP1OE and abap1ET flowers. Data were normalized with UBQ14 as reference gene and were compared with wild-type. Data shown represent mean values obtained from independent amplification reactions (n = 3) and biological replicates (n = 2). Each biological replicate was performed with a pool of 15 inflorescences. Bars indicate mean ± standard error of biological replicates. A statistical analysis was performed by t-test (p-value < 0.05). Asterisks (*) indicate significant changes. (B–G) Nomarski microscopy of cleared tissues. (B) promABAP1:GUS activity in the ovary prior to fertilization. (C) promABAP1:GUS activity early after fertilization. Arrow and arrowhead point to embryo and chalaza expression, respectively. (D) Decrease in GUS activity in embryos of 72 h (heart stage). The expression in the chalazal chamber, however, remains (arrow). (E) In torpedo stage, GUS activity is not seen neither in the embryo or chalaza. (F) promABAP1:GUS activity in anthers. Arrow points to GUS activity in pollen. (G) Cross section of anthers with promABAP1:GUS activity in pollen. (H,J) Localization of ABAP1 protein by epifluorescence of reproductive tissues using anti-ABAP1 antibodies conjugated with Alexa Fluor 488 and (I,K) corresponding DIC microscopy. (H,I) ABAP1 protein localization in a pollen sac cross section. (J,K) ABAP1 protein localization in cross section of ovary and ovules. Dashed lines indicate the perimeter of ovules and the full line is around the embryo sac. The scale bars correspond to 100 μm in (B), 20 μm in (C–G), and to 10 μm in (H–K).

