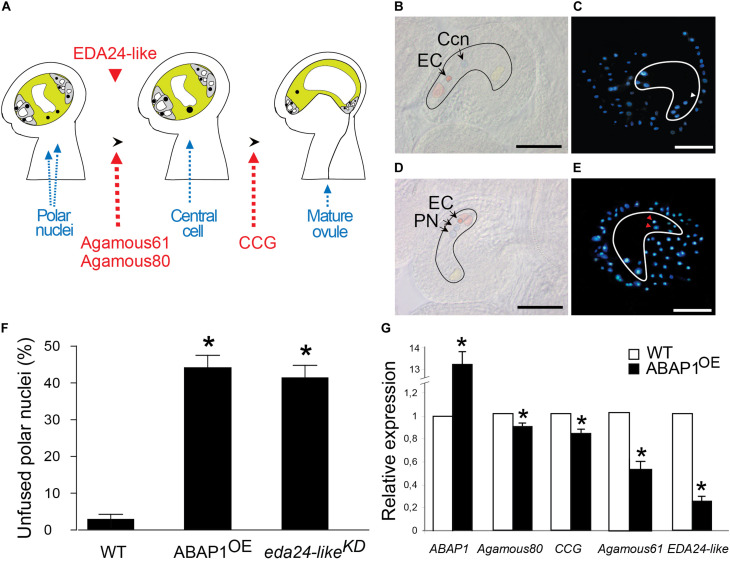
FIGURE 5.
Defective female gametophyte development in ABAP1OE. (A) Schematic representation of the events taking place during maturation of the female gametophyte. The final embryo sac is a polarized structure with two main distinct regions: the micropyla and the chalaza. Red arrows indicate gene markers of embryo sac developmental stages. Red arrowhead represents the timing of EDA24-like expression. (B–E) Micrographs of wild-type and ABAP1OE ovules. Embryo sacs and embryo sac cells were artificially outlined for better visualization. DIC microscopy (B) and DAPI staining (C) of wild-type ovules indicate the central cell nucleus (Ccn and white arrowhead) formed by fusion of the two polar nuclei. DIC microscopy (D) and DAPI staining (E) of ABAP1OE ovules show two unfused polar nuclei (PN and red arrowheads). EC, egg cell; Ccn, central cell nucleus; PN, polar nuclei. Scale bars at (B–E) represent 20 μm. (F) Percentage of unfused polar nuclei quantified in emasculated flowers at stage 13 (FG6-FG7) from wild-type Col, ABAP1OE and eda24-likeKD plants. For WT, 6 ovaries were analyzed, with a minimum of 25 and a maximum of 39 ovules analyzed per ovary. For ABAP1OE, 14 ovaries were analyzed, with a minimum of 25 and a maximum of 36 ovules analyzed per ovary. For eda24-likeKD, 8 ovaries were analyzed, with a minimum of 23 and a maximum of 34 ovules analyzed per ovary. A statistical analysis was performed by t-test (p-value < 0.05). Asterisks (*) indicate significant changes. (G) Relative mRNA levels of ABAP1, Agamous 80, CCG, Agamous 61 and EDA24-like were determined by qRT-PCR in wild-type and ABAP1OE flower buds. Data were normalized with UBI14 as reference gene and were compared with wild-type. Each biological replicate was performed with a pool of 15 flower buds. Bars indicate mean ± standard error of biological replicates. A statistical analysis was performed by t-test (p-value < 0.05). Asterisks (*) indicate significant changes.

