Fig. 4.
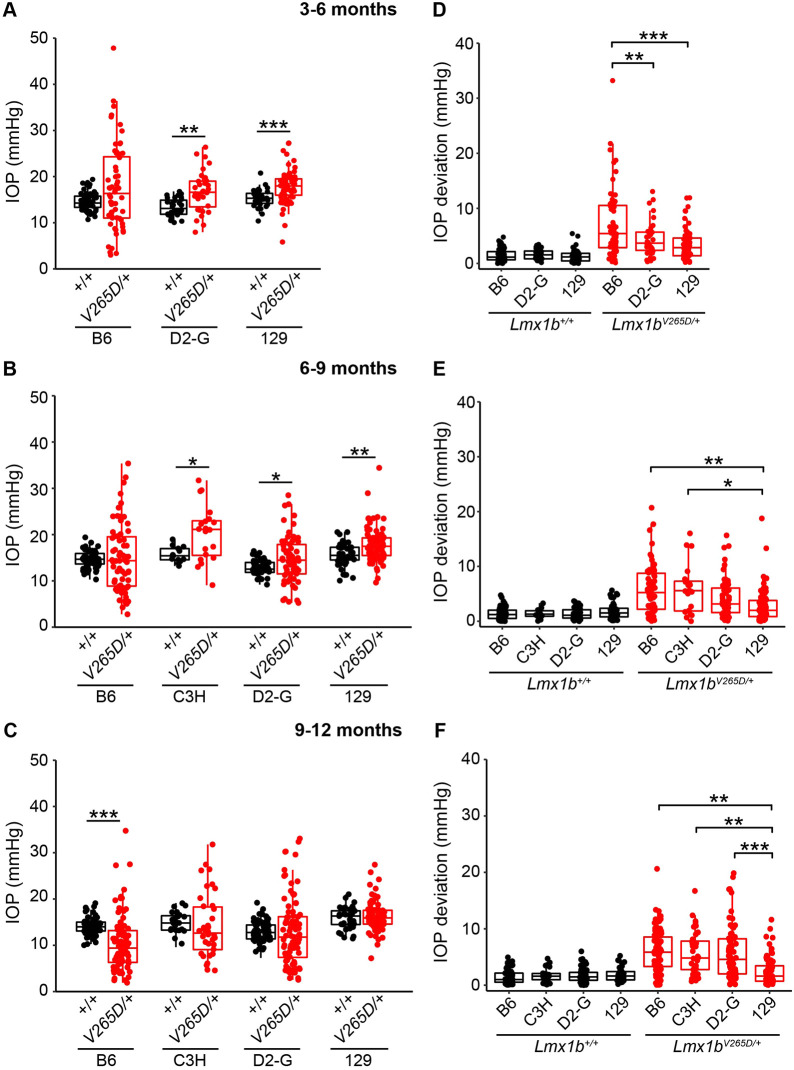
IOP in Lmx1b mutants. (A-C) Boxplots of IOP (interquartile range and median line) clearly indicate spreading of IOP in mutants of all strain backgrounds with clear IOP elevation in some mutants. (A,B) Lmx1bV265D/+ mutants of D2-G and strain 129 backgrounds have significantly elevated IOP compared to respective WT controls at 3-6 months and 6-9 months. C3H mutants have elevated IOP at 6-9 months compared to WT controls (P=0.0032). Although IOP was not measured, anterior chamber deepening suggests that IOP is elevated in many C3H mutants prior to 6 months of age (Fig. 1). (C) Owing to an increase in abnormally low IOP values, B6.Lmx1bV265D/+ mice have a significantly lower IOP average than WT controls at 9-11 months (P=8.2×10⁻⁷). (D-F) Boxplots of IOP deviation (absolute value of difference to respective WT mean value, see Materials and Methods). At all ages, WT groups had minimal IOP deviation, with no values deviating more than 7 mmHg. (D) At 3-5 months, B6 mutants have a significantly greater IOP deviation compared to those of D2-G (P=0.0068) and strain 129 (P=4.5×10⁻⁵) backgrounds. (E,F) Strain 129 mutants have significantly less IOP deviation compared to B6 and C3H mutants at 6-9 months and all other backgrounds at 9-12 months. *P<0.01, **P<0.001, ***P<0.0001 (two-tailed Welch's t-test; see Table S2 for exact P-values).

