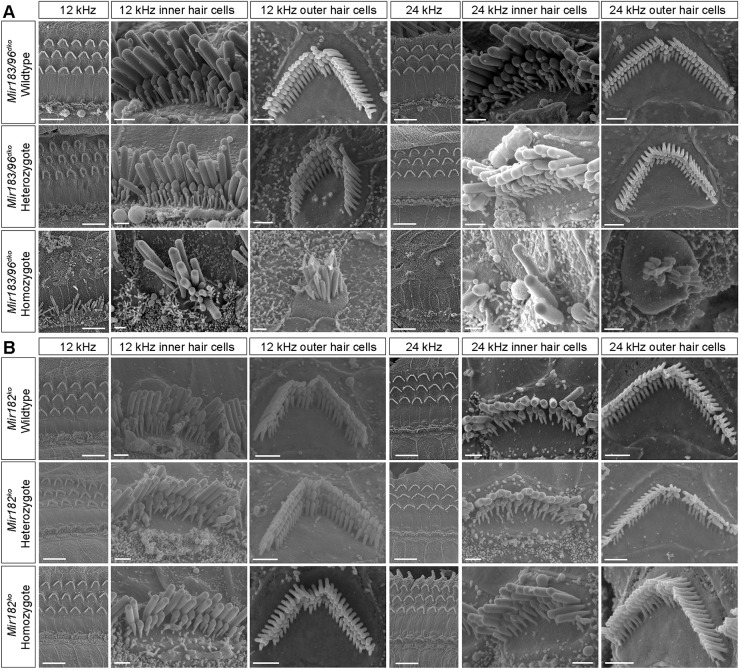
Fig. 3.
Scanning electron micrographs of the organs of Corti of Mir183/96dko mice at P28 and Mir182ko mice at P56. (A) Mir183/96dko mice at P28. (B) Mir182ko mice at P56. Two best-frequency regions of the organ of Corti are shown: 12 kHz and 24 kHz (68% and 43% of the way along the organ of Corti from base to apex, respectively). For each region, the left-hand column shows inner and outer hair cell rows (scale bars: 10 µm), and the other two columns show an inner and an outer hair cell close up (scale bars: 1 µm). (A) The top row shows wild-type hair cells (n=6 mice), the middle row shows heterozygote hair cells (n=6 mice) and the bottom row shows homozygote hair cells (n=5 mice). (B) The top row shows wild-type hair cells (n=1 mouse), the middle row shows heterozygote hair cells (n=2 mice) and the bottom row shows homozygote hair cells (n=3 mice).

