
Figure 5. Graft evolution over time.
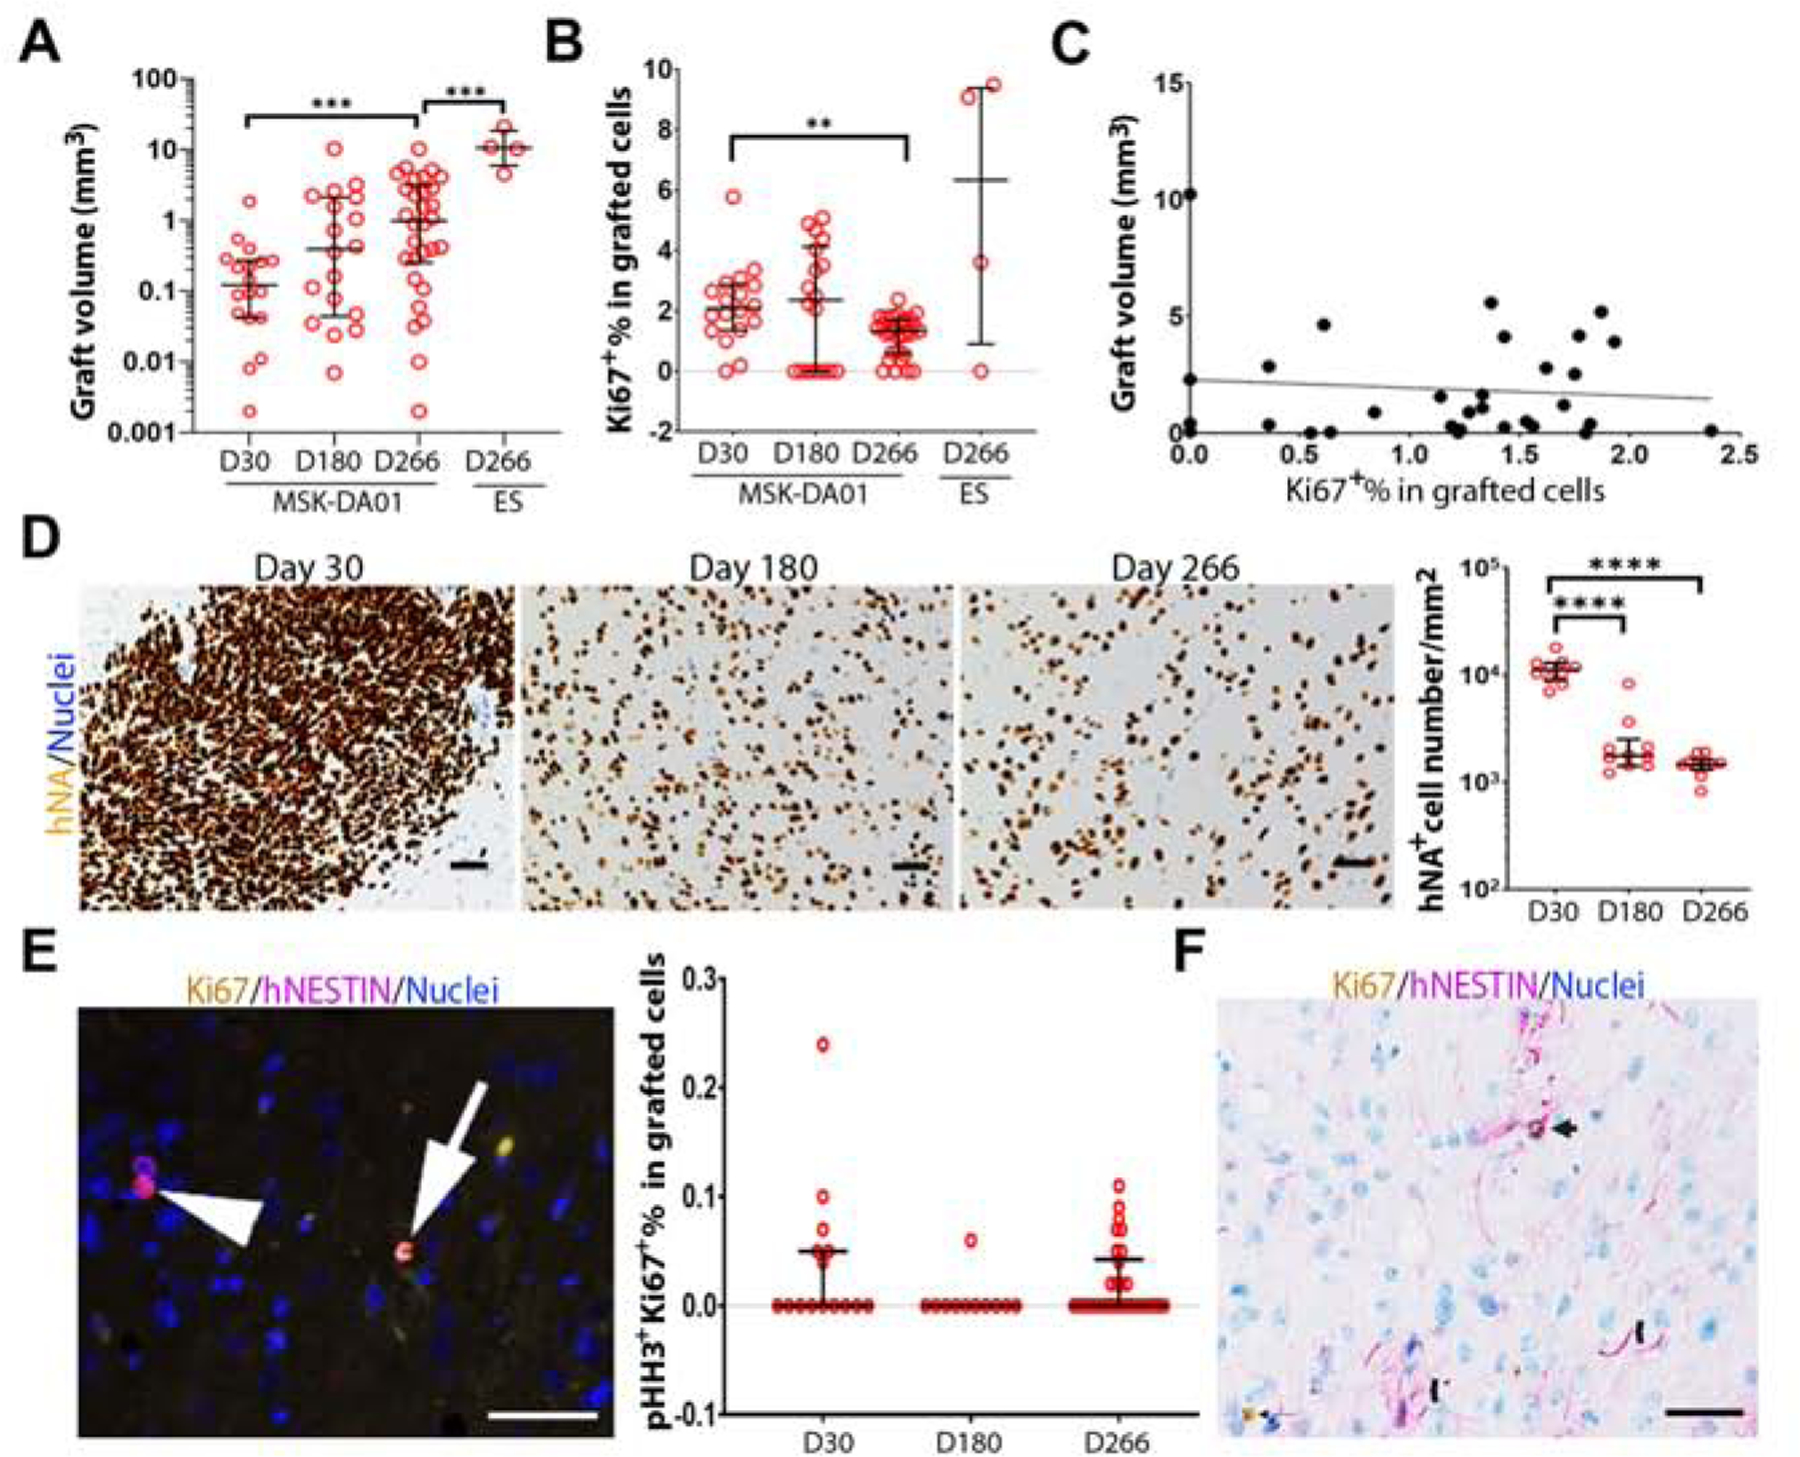
(A) Graft volumes for MSK-DA01 on day 30 (n=18), 180 (n=18), 266 (n=30) and 100% ES on day 266 (n=4). (B) Percentage Ki67 in the MSK-DA01 grafts on different days and in the 100% ES group on day 266. (C) There is no clear correlation between the graft volume and the percentage of Ki67 in MSK-DA01 grafts at day 266 (r =−0.09608, P=0.6071, n=30). (D) Representative immunohistochemical images of MSK-DA01 grafts at different timepoints, immunostained for hNA. Hematoxylin nuclear stain. Graph showing the decreasing density of human cells per mm2 over time. n=10 mice/group. (E) The presence of pHH3+Ki67+ cell (arrow), pHH3−Ki67+ cell (arrowhead) in the MSK-DA01 graft (left panel). The percentage of pHH3+Ki67+ in MSK-DA01 grafted cells on day 30 (n=15), 180 (n=11), 266 (n=30) post grafting (right panel). Data represented as median with interquartile range. Each circle represents one animal. (F) Some hNESTIN+ cells expressed Ki67 (arrow). NESTIN+ processes were observed in the graft (chevron). The data are represented as median with interquartile range. *P<0.05, ***P<0.001, ****P<0.0001. Scale bars=50 µm.