Figure 6.

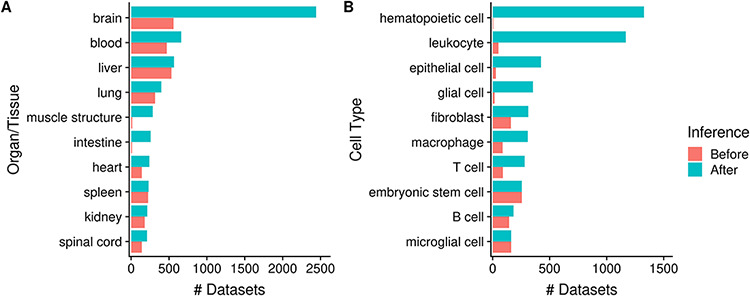
Numbers of datasets grouped by organ/tissue (A) and cell type (B); the colors indicate the number of associated datasets before (red) and after (blue) ontology inference (Ndataset = 8292).

Numbers of datasets grouped by organ/tissue (A) and cell type (B); the colors indicate the number of associated datasets before (red) and after (blue) ontology inference (Ndataset = 8292).