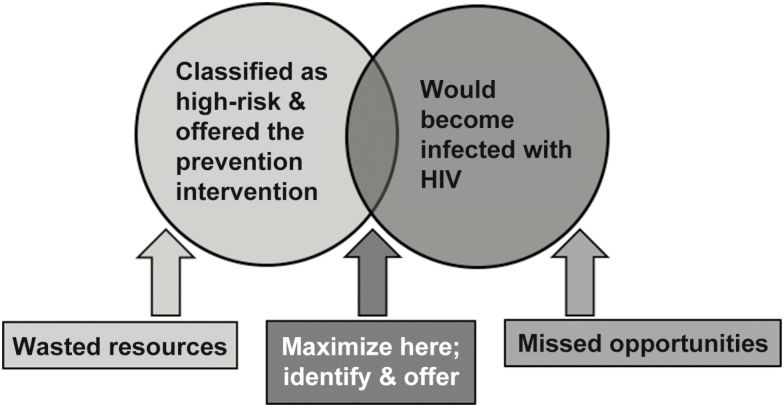
Figure 1.
Schematic representation of a targeted prevention strategy with the goal of maximizing the intersection of the population offered intensified prevention (light gray) with the population at risk of seroconversion (medium-gray). Sensitivity is the proportion of individuals at high risk who are correctly identified by the strategy: the number in the dark-gray intersection divided by the number in the medium-gray circle. The rate of positive predictions is the proportion of the population targeted: the number in the light-gray circle divided by the total population size. The number needed to target (equal to 1/positive predictive value) is the number classified as high risk per seroconversion identified: the number in the light-gray circle divided by the number in the dark-gray intersection. Abbreviation: HIV, human immunodeficiency virus.

