
Figure 4. Screening anti-mPLS1 and anti-mESPN1 monoclonal antibodies.
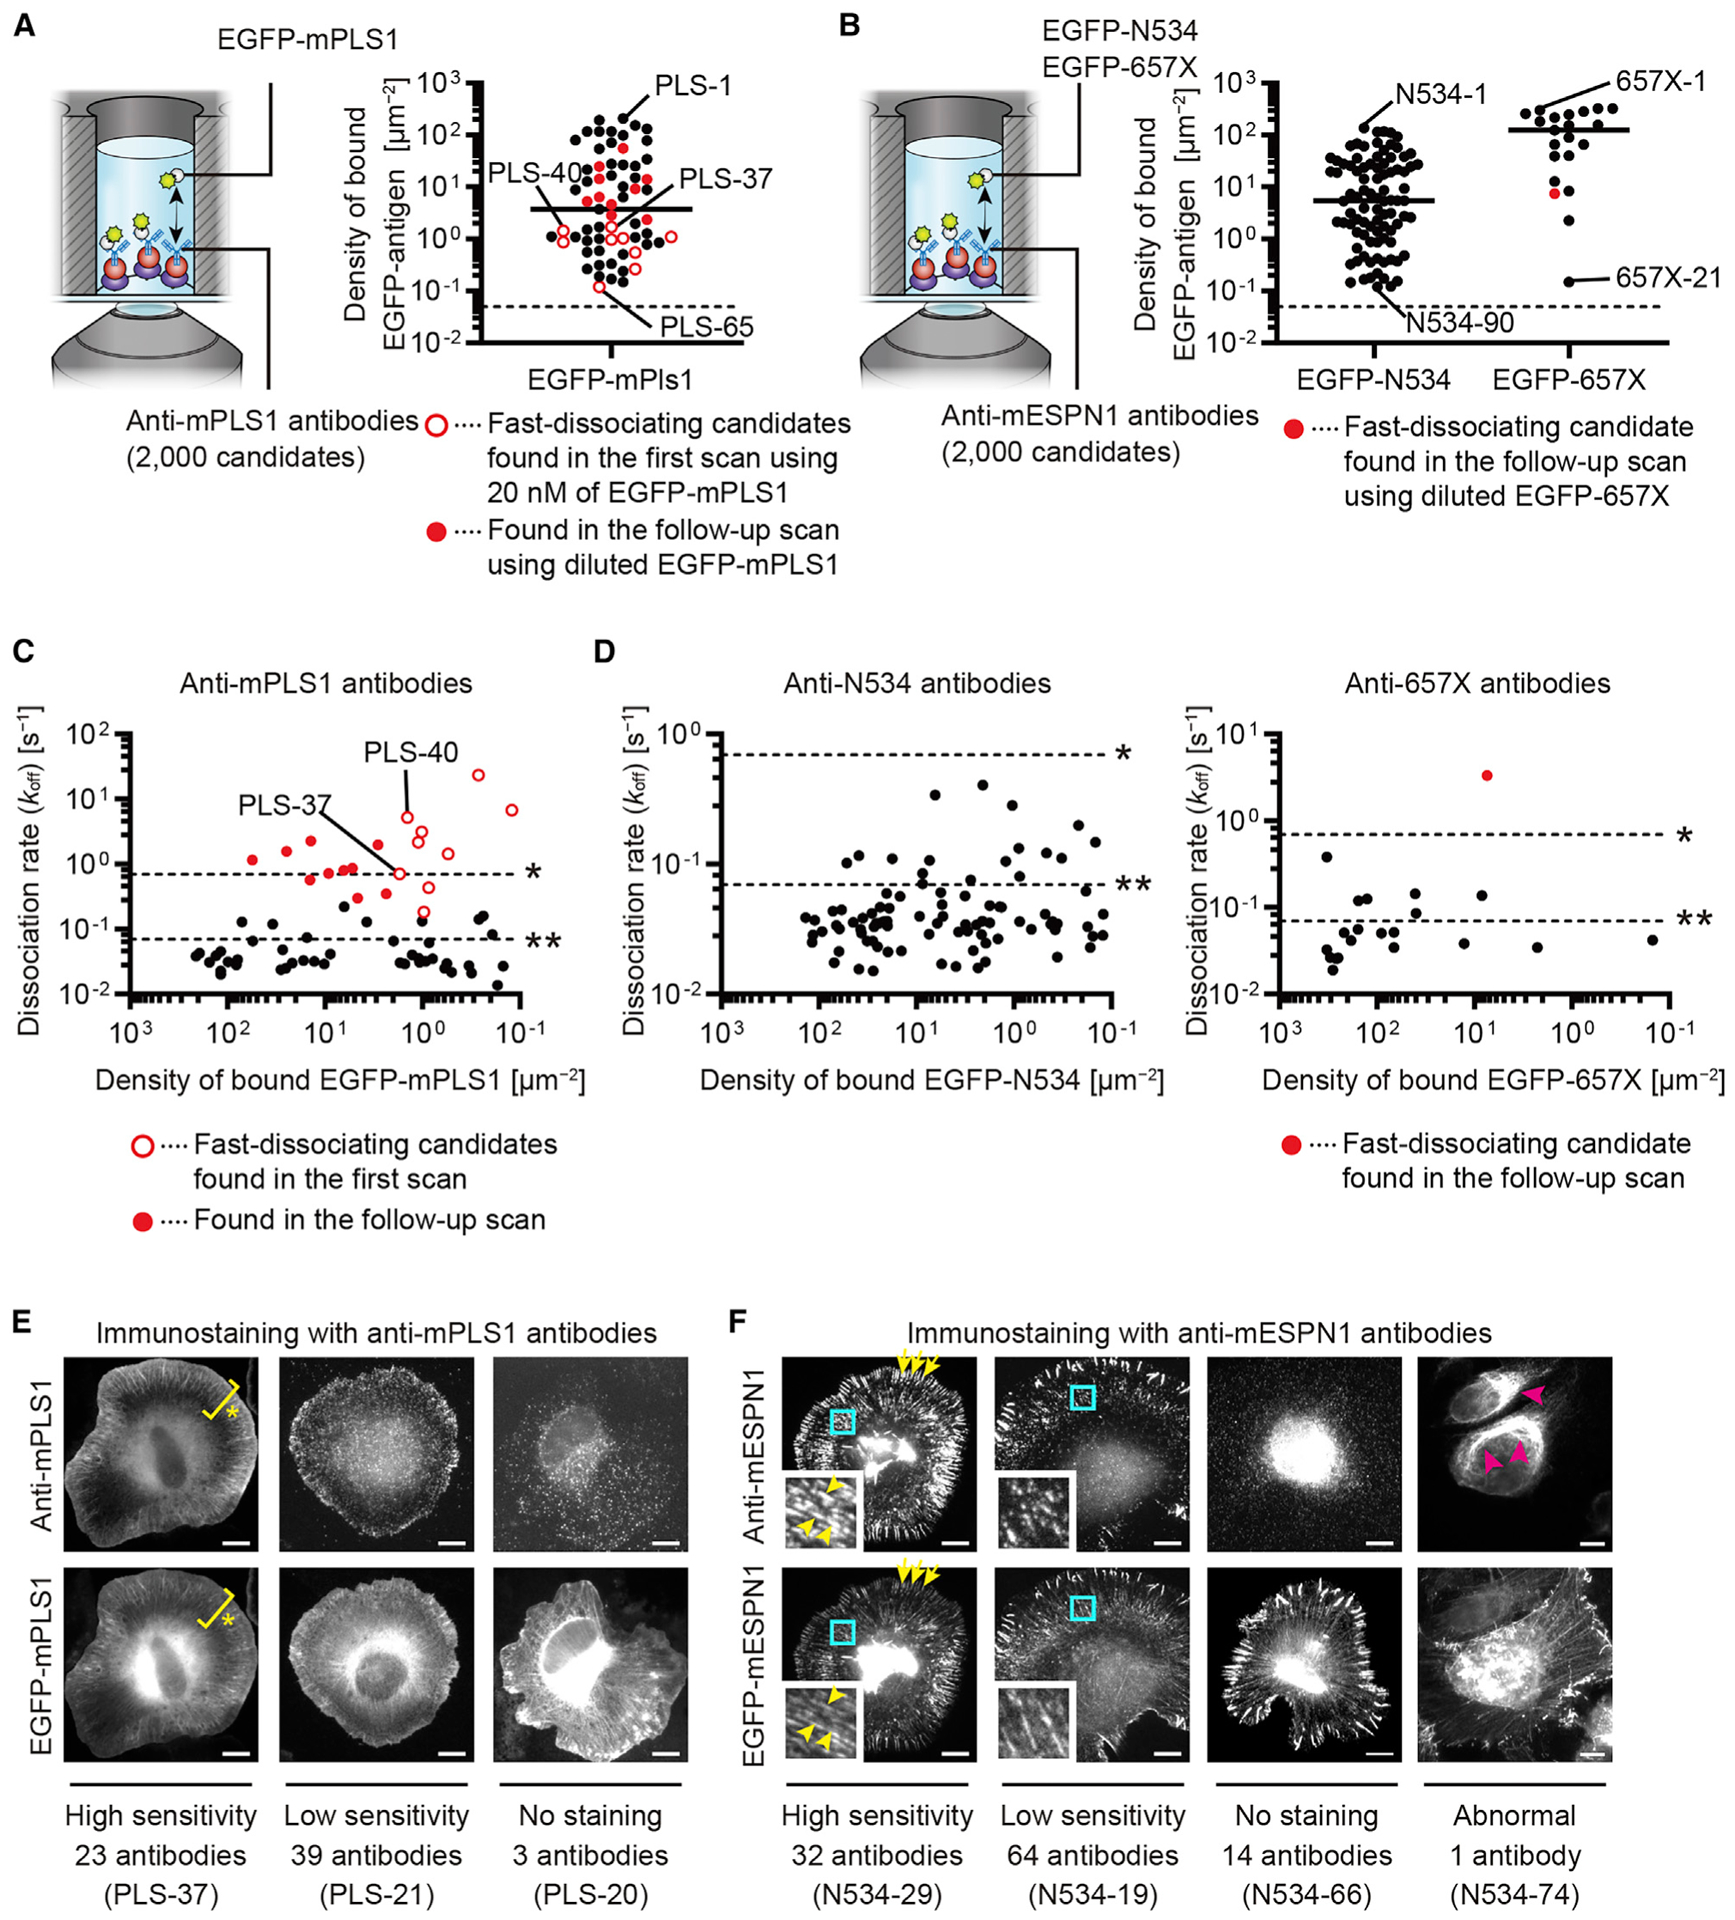
(A) Screening anti-mPLS1 antibodies. Among 2,000 candidates, 65 antibodies responded to EGFP-mPLS1 applied at 20 nM. Antibodies are plotted against densities of bound EGFP-mPLS1. Open red circles are fast-dissociating candidates found in the first scan. Closed red circles are those found in a follow-up scan with diluted EGFP-mPLS1 (0.1–20 nM). Representative images are in Figure S3D. Dashed line is maximum binding to antibody-free control glass surface, 0.05 spots/μm2 (n = 3). Markers indicate means determined using two images. Bar, median.
(B) Screening anti-mESPN1 antibodies. Among 2,000 candidates, 90 antibodies responded to 5 nM EGFP-N534 (anti-N534 antibodies), and 21 antibodies responded to 20 nM EGFP-657X (anti-657X antibodies). Follow-up scans were performed using EGFP-N534 at 0.1–5 nM and EGFP-657X at 0.1–20 nM. One anti-657X antibody showed fast-dissociation during the follow-up scan with 0.1 nM EGFP-657X (closed red circle). Dashed lines are maximum binding to antibody-free glass surface, 0.05 spots/μm2 (n = 3 for EGFP-N534 and EGFP-657X). Markers indicate means determined using two images. Bars, medians.
(C) Kinetic summary of anti-mPLS1 antibodies. koff values determined using diluted EGFP-mPLS1 (0.1–20 nM). Time-lapse images and regression curves of PLS-37 and PLS-40 are in Figures S3E and S3F. Dashed lines indicate koff = 0.693 s−1 (half-life = 1 s, asterisk) and 0.0693 s−1 (half-life = 10 s, double asterisks). Compatible with the screening, fast-dissociating candidates showed faster koff than other antibodies (open and closed red circles).
(D) Kinetic summary of anti-N534 and anti-657X antibodies. koff values determined using diluted EGFP-N534 (0.1–5 nM) or EGFP-657X (0.1–20 nM). One anti-657X fast-dissociating candidate showed faster koff than other antibodies (closed red circle). Most antibodies showed koff slower than 0.693 s−1 (half-life = 1 s), which distribute at a slower range than anti-mPLS1 antibodies.
(E) Immunostaining using anti-mPLS1 antibodies and XTC cells expressing EGFP-mPLS1 (representative images). EGFP-mPLS1 was distributed in lamellipodia (asterisks). Sensitivity of staining was different among the antibodies: 23 antibodies detected mPLS1 concordantly with EGFP tag (high sensitivity) and 39 antibodies at lower densities than EGFP tag (low sensitivity). Three antibodies did not detect mPLS1 (no staining). Bars, 10 μm.
(F) Immunostaining using anti-mESPN1 antibodies and XTC cells expressing EGFP-mESPN1 (representative images). Small panels magnify cyan rectangles. EGFP-mESPN1 was distributed on thick actin fibers induced by mESPN1 and on filopodia (yellow arrowheads and arrows). Sensitivity of staining was different: 32 antibodies detected mESPN1 concordantly with EGFP-tag (high sensitivity) and 64 antibodies at lower densities then EGFP-tag (low sensitivity). Fourteen antibodies did not detect mESPN1 (no staining). One anti-N534 antibody abnormally stained perinuclear organelles (magenta arrowheads, abnormal).
Bars, 10 μm. See also Figures S3 and S4.