
Figure 6. Super-resolution images acquired with anti-mPLS1 and anti-mESPN1 Fab probes.
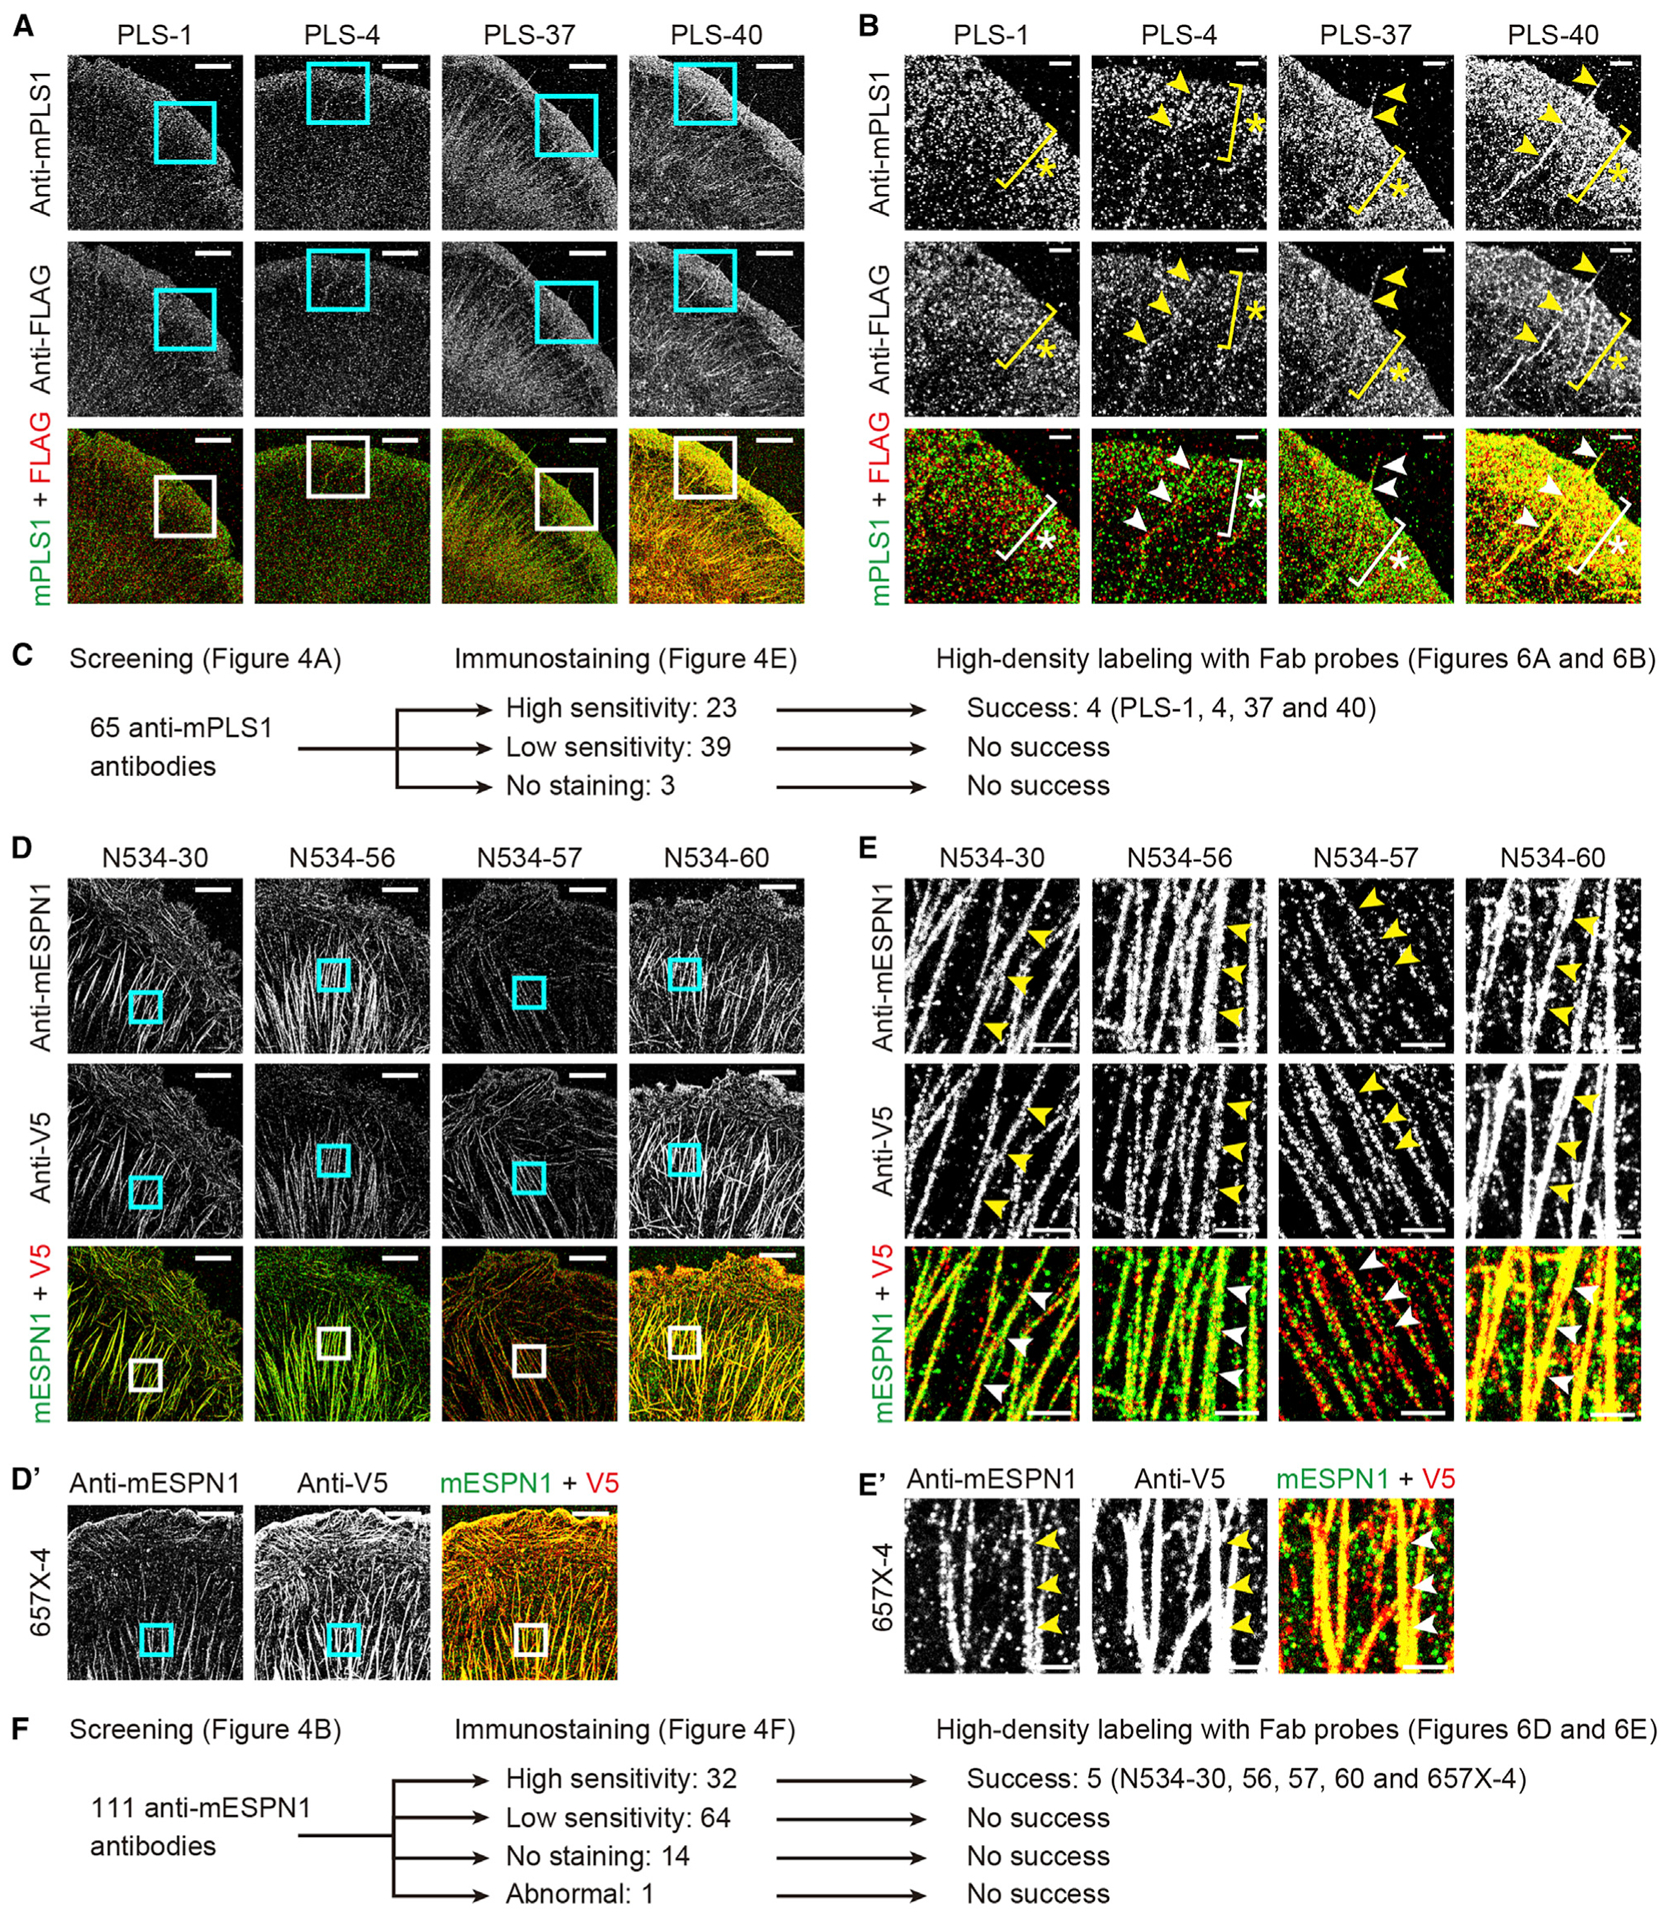
(A) Images acquired with four anti-mPLS1 Fab probes achieving high-density labeling and XTC cells expressing FLAG-mPLS1. Counter-imaging, FLAG-2 Fab probe. Images reconstructed from 50,000 frames acquired every 50 ms. Fab probes, 1 nM. Bars, 5 μm.
(B) Magnified images of rectangles in (A). FLAG-mPLS1 was detected in lamellipodia (asterisks) and filopodia (arrowheads) by anti-mPLS1 and FLAG-2 Fab probes. Labeling density was slightly higher by PLS-37 and PLS-40 Fab probes, which were synthesized from fast-dissociating anti-mPLS1 antibodies and showed faster koff than PLS-1 and PLS-4 Fab probes (Figure S8B). Bars, 2 μm.
(C) Flow chart of anti-mPLS1 antibodies showing relationship between synthesis of successful Fab probes and immunostaining.
(D) Super-resolution images acquired with anti-mESPN1 Fab probes and XTC cells expressing mESPN1-V5. Five Fab probes achieved high-density labeling. Four Fab probes were derived from anti-N534 antibodies and one from an anti-657X antibody. Counter-imaging, V5-3 Fab probe. Images reconstructed from 60,000 frames acquired every 50 ms. Fab probes, 1 nM. Bars, 5 μm.
(E) Magnified images of rectangles in (D). mESPN1-V5 was detected on thick actin fibers by anti-mESPN1 and V5-3 Fab probe (arrowheads). Labeling density was slightly lower by N534-57 and 657X-4 Fab probes probably because of their slower koff than the other three Fab probes (asterisk, Figure S8B). Bars, 1 μm.
(E) Flow chart of anti-mESPN1 antibodies showing relationship between synthesis of successful Fab probes and immunostaining.