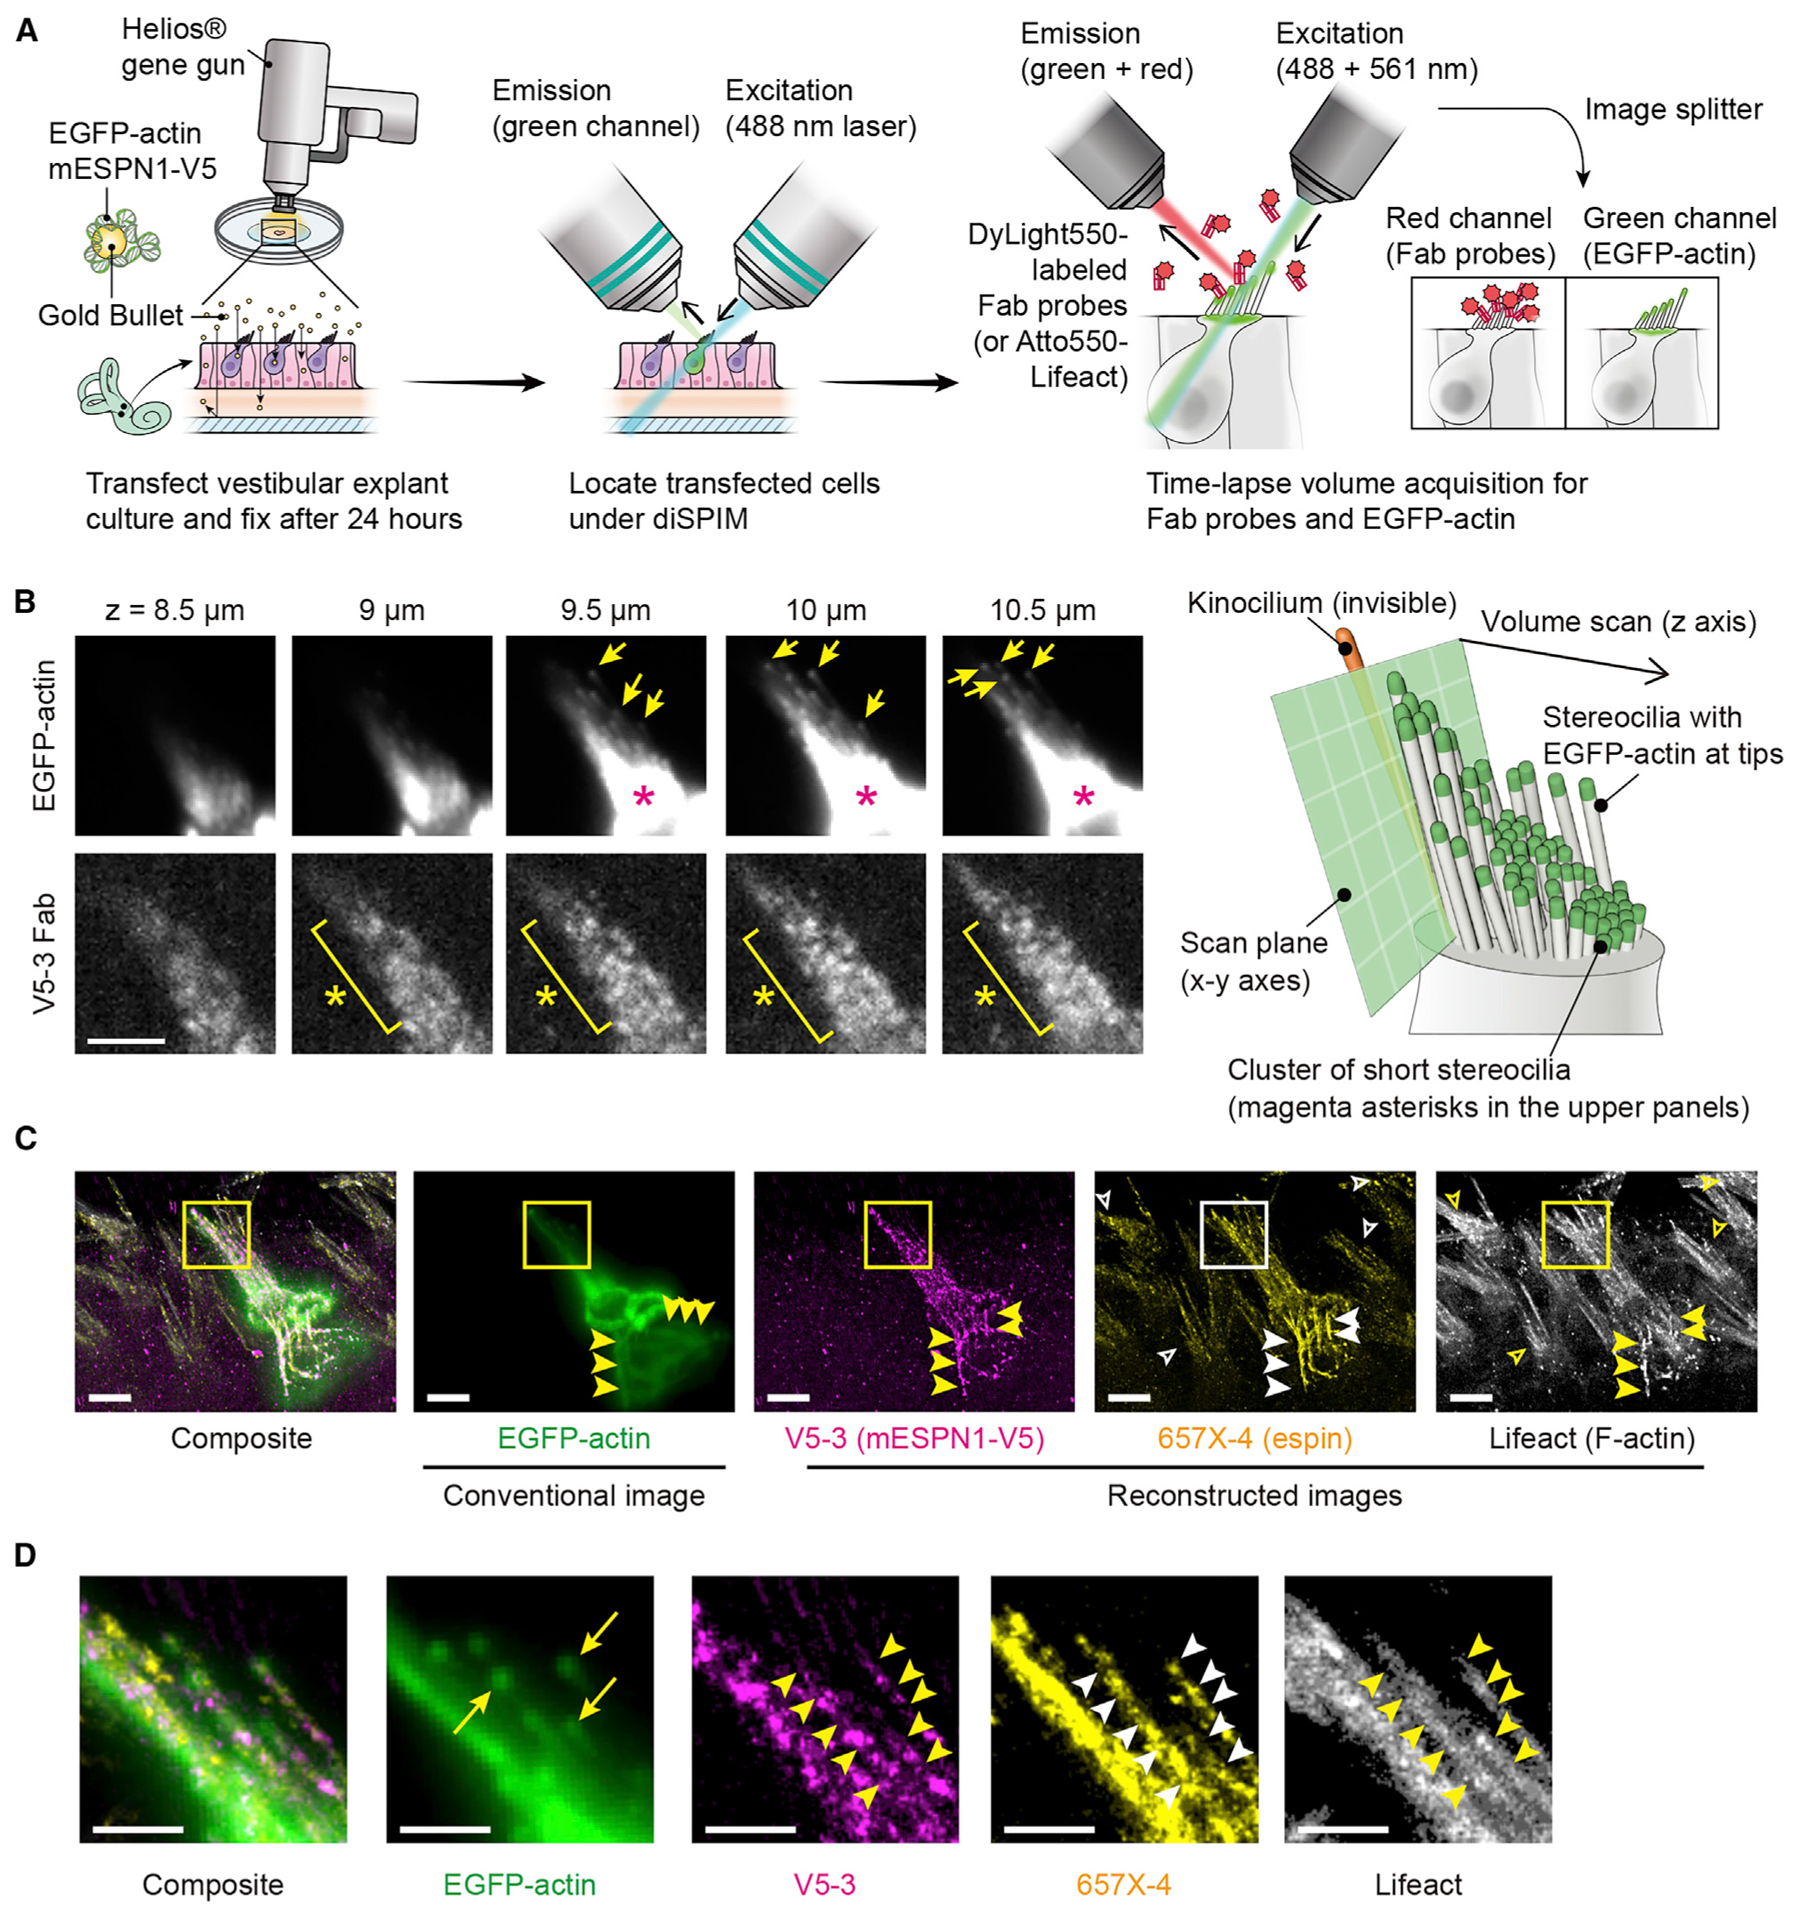
Figure 7. Tissue imaging using light-sheet microscopy.

(A) Gene-gun transfection and diSPIM imaging. Vestibular explant cultures were transfected to express EGFP-actin and mESPN1-V5, fixed 24 h later. Transfected cells were located under diSPIM and imaged sequentially using DyLight550-labeled Fab probes and Atto550-labeled Lifeact, acquiring a time-lapse volume scan every 5 s (100-ms acquisitions every 0.5 μm in z, 40 total slices per volume). Images of EGFP-actin were acquired simultaneously using an image splitter for drift correction.
(B) Representative volume scans of EGFP-actin and Fab probe (V5-3 shown). EGFP-actin was detected at each stereocilium tip (arrows). The high-intensity area is a cluster of short stereocilia (magenta asterisks). Bound Fab probes detected as fluorescent spots (yellow asterisks) and used to reconstruct images in (C). Bar, 5 μm.
(C) Orthogonal projection showing conventional volume scan of EGFP-actin (162-nm bin size, 0.5-μm z-spacing) and reconstructed images of mESPN1-V5, endogenous espin, and endogenous F-actin (81-nm bin size, 0.5-μm z-spacing). Images of two Fab probes (V5-3 and 657X-4) and Lifeact were reconstructed from 720, 1,440, and 1,440 volume acquisitions, respectively. V5-3 Fab probe specifically bound to the transfected cell (V5-3, center cell), whereas 657X-4 Fab probe and Lifeact visualized stereocilia of non-transfected cells (657X-4 and Lifeact, open arrowheads). Abnormal rod-like actin fibers indicate an intact actin bundling function of overexpressed mESPN1-V5. (yellow and white arrowheads). Fab probes, 1 nM. Lifeact, 0.5 nM. Bars, 5 μm.
(D) Comparison of molecular turnover between EGFP-actin and mESPN1-V5 using individual stereocilia. Images are magnified rectangles in (C). EGFP-actin is incorporated at the tips (EGFP-actin, arrows), whereas mESPN1-V5 was detected along the entire length of stereocilia (V5-3, arrowheads). Stereocilia are also visualized using 657X-4 and Lifeact probes (arrowheads).
Bars, 2 μm. See also Figure S9.
