Fig. 4.
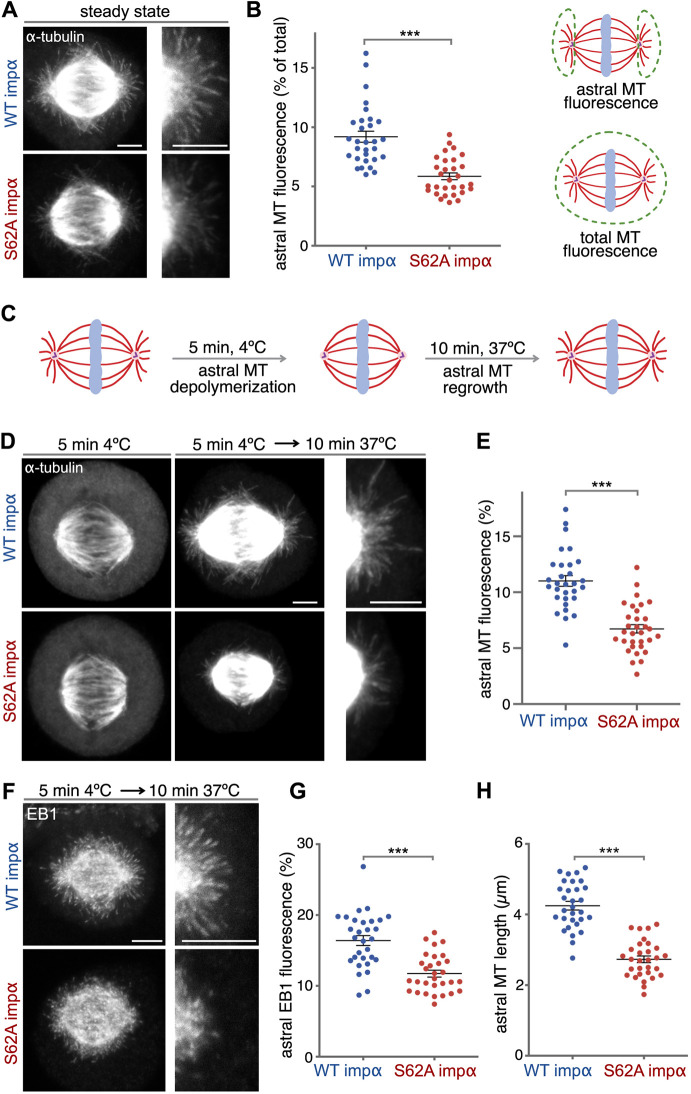
Importin α S62A inhibits microtubule growth. (A) Importin α (impα) S62A compromises astral microtubules. NRK cells expressing WT importin α or importin α S62A were arrested at metaphase using MG132 for 1 h and stained for α-tubulin. Maximum intensity projections of confocal z-sections are shown. Enlargements of the astral microtubule area are shown in the panels on the right. (B) Quantitation of the experiment shown in A. Astral microtubule (MT) fluorescence was measured as the percentage of astral microtubule intensity relative to the total microtubule intensity, as shown in the schematic. n>30. ***P<0.0001 (Student's t-test). (C) Schematic illustration of the cold-induced astral microtubule regrowth assay. Astral microtubules were depolymerized by 5 min of cold treatment, and then allowed to regrow by shifting the cells back to 37°C for 10 min. (D) Importin α S62A inhibits astral microtubule regrowth upon cold treatment. NRK cells arrested at metaphase using MG132 were placed on ice for 5 min to depolymerize astral microtubules but not spindle filaments. After 10 min regrowth at 37°C, cells were fixed and stained for α-tubulin. Confocal microscopy images represent maximum intensity projections. Enlargements of the astral microtubule area are shown in the panels on the right. (E) Astral microtubule fluorescence was calculated as in B. n>30. ***P<0.0001 (Student's t-test). (F) Importin α S62A inhibits EB1 localization to the astral area. EB1 was stained following the procedure described in C,D. Maximum intensity projections are shown. Enlargements of the astral microtubule area are shown in the panels on the right. (G) EB1 fluorescence was calculated as for astral microtubule intensity. n>30. ***P<0.0001 (Student's t-test). (H) Importin α S62A shortens astral microtubule length. The lengths of astral microtubules were determined as the distance between the tip of an EB1 signal comet and the spindle pole. For each cell, the average length of the three longest filaments from each pole was used to represent nascent microtubule length. n>30. ***P=0.019 (Student's t-test). Data in B,E,G,H are presented as mean±s.e.m. Scale bars: 5 µm.

