FIG. 3.
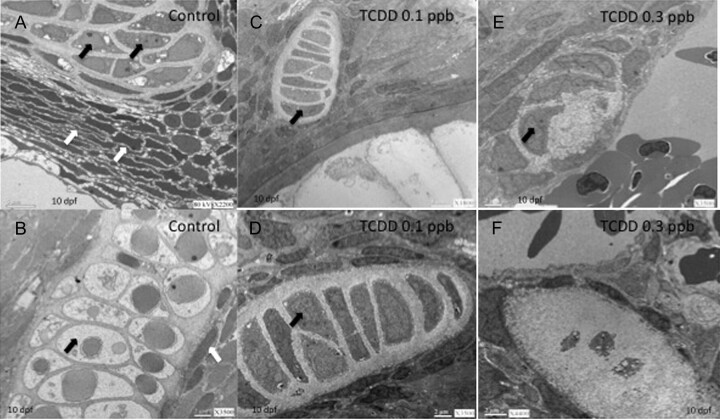
Ultrastructure of medaka hypural. Embryos were exposed to either DMSO (vehicle control), 0.1 ppb TCDD, or 0.3 ppb TCDD at 4 hpf for 1 h, washed, and incubated in ERM at 26°C until 10 dpf. Then, embryos were manually dechorionated, fixed, and processed for TEM. (A and B) DMSO control; (C and D) 0.1 ppb TCDD; (E and F) 0.3 ppb TCDD. White arrows in panel A indicate mesenchymal cell condensations. Black arrows indicate differentiated chondrocytes in panels A–E. Note that cartilage structure in panels C–E are smaller than those of control (panels A and B) and contain fewer well-differentiated chondrocytes. Black arrow in panel B indicates hypertrophic chondrocytes. Chondrocytes of F appear to be arrested in growth and differentiation. Magnifications for panels are (A) 2200×, (B) 3500×, (C) 1800×, (D) 3500×, (E) 3500×, and (F) 4400×.

