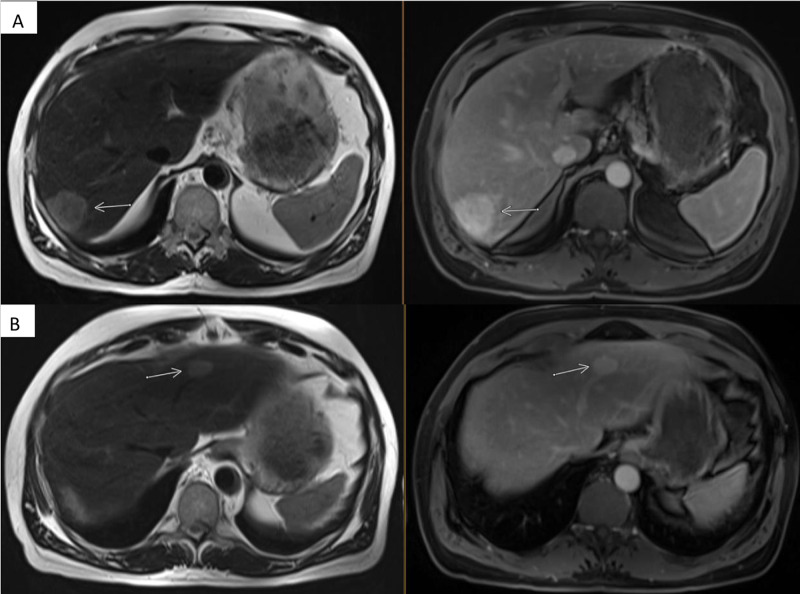
Figure 4. Interim MRI images while on adjuvant chemotherapy.
A: Axial T2 weighted image through the liver demonstrates increased T2 signal and conspicuity of the right hepatic lobe mass (arrow, left). Contrast-enhanced imaging was performed with an extracellular agent (gadobutrol) for this MRI. A three-minute post-contrast equilibrium phase image in the axial plane shows delayed enhancement of the mass (arrow, right).
B: Axial T2 weighted image and three-minute post-contrast equilibrium phase showing similar T2 hyperintensity and delayed enhancement in the left hepatic lobe mass (arrows).

