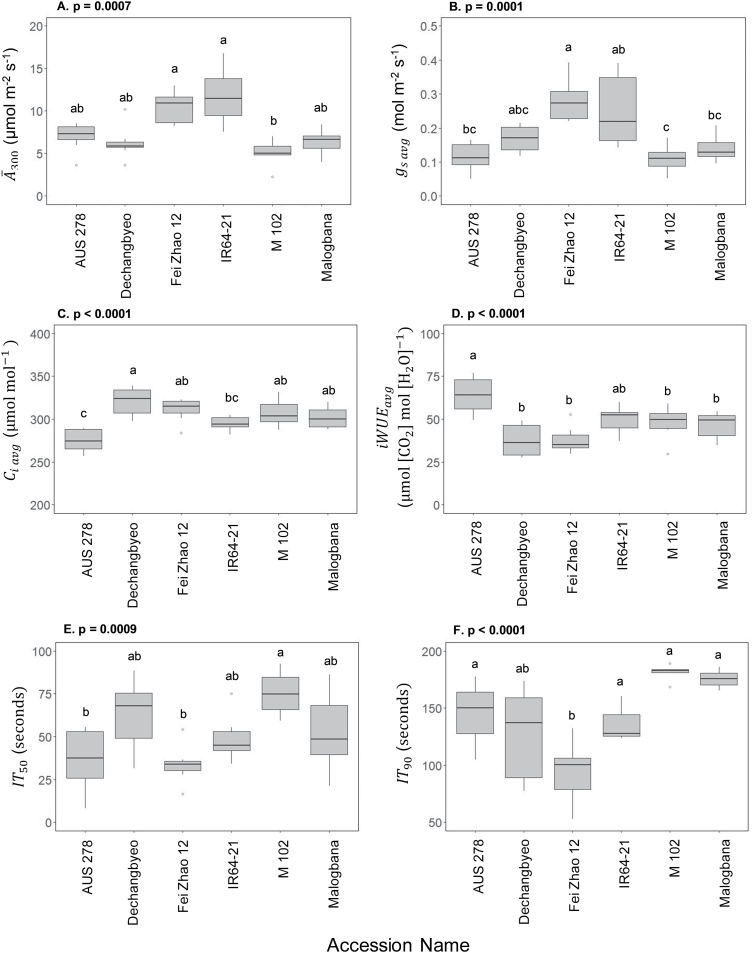
Fig. 3.
Mean and variation for flag leaf non-steady-state photosynthetic performance in six rice accessions. (A) CO2 assimilation during the first 300 s of induction (Ā300), (B) average stomatal conductance during the first 300 s of induction (gs avg), (C) average intrinsic water use efficiency (iWUEavg=Ā300/gs avg), (D) average intercellular CO2 concentration (Ci avg), (E and F) time at which A reached 50% and 90% of A300 (IT50 and IT90, respectively). Accessions are ordered by median performance. Letters are indicative of a significant difference between accessions.

