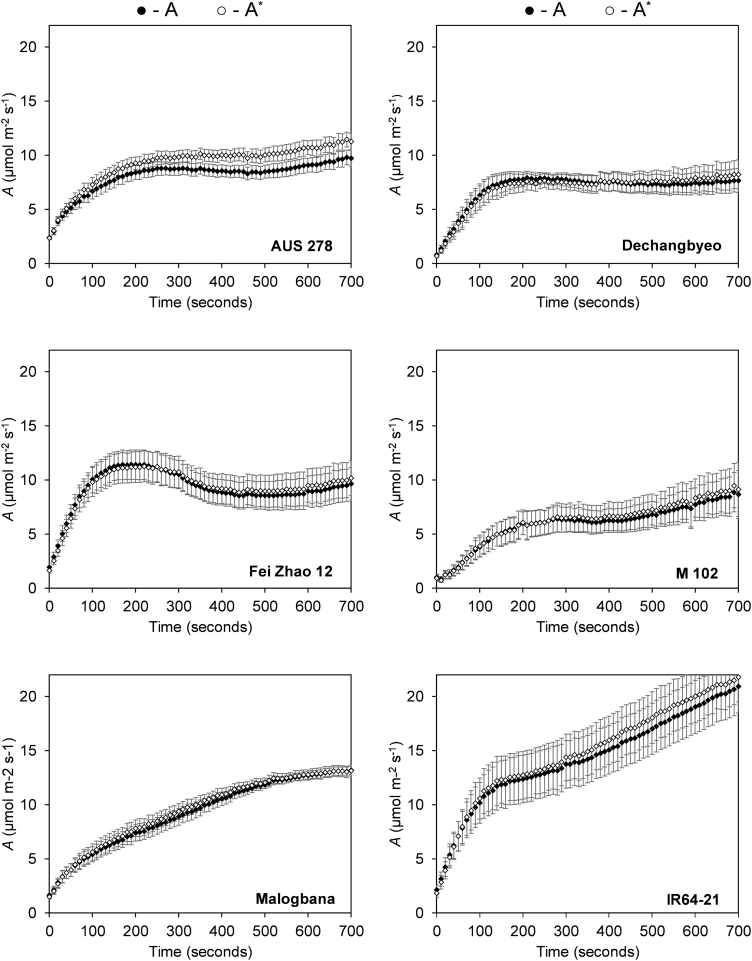
Fig. 5.
The response of uncorrected leaf CO2 assimilation (A; filled circles) and the response of leaf CO2 assimilation corrected for stomatal limitation (A*; open circles) over time in flag leaves of six rice accessions. The first line at 100 s indicates the mean time for the activation of Rubisco (τ) per accession. Each point represents the mean of at least six plants ±SE (n=6–8).

