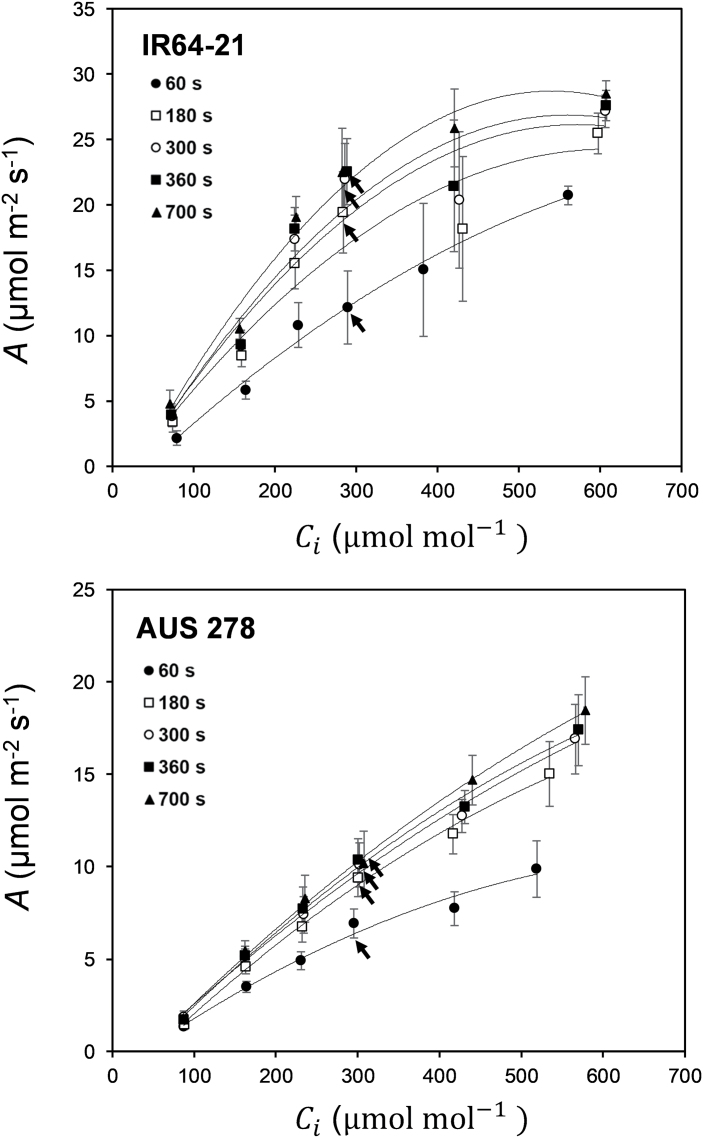
Fig. 6.
The responses of leaf CO2 assimilation (A) to intercellular [CO2] (Ci) at different points in time after the beginning of photosynthetic induction for IR64-21 and AUS 278. Times after induction were: 60 s (filled circles), 180 s (open squares), 300 s (open circles), 360 s (filled squares), and 700 s (filled triangles) from the start of induction. The operating point of each curve at 400 µmol mol–1 atmospheric [CO2] (Ca) is indicated with a black arrow. Each point is the mean (±SE) of four plants of each rice accession.

