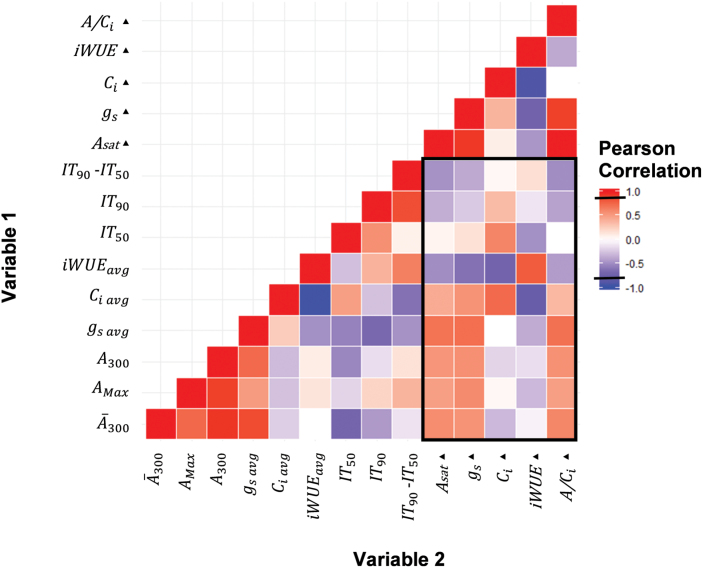
Fig. 7.
Pearson correlation (R) of all measured dynamic and steady-state (filled tiangles) photosynthetic traits measured in rice flag leaves. Negative correlations are in blue, positive correlations are in red. Traits at steady-state are: intrinsic water-use efficiency (iWUE=A/gs), transpiration (E), intercellular CO2 concentration (Ci), stomatal conductance (gs), and net CO2 assimilation in saturating light (Asat). Traits at non-steady state over the first 300 s of induction are: the time at which A reached 50% and 90% of A300 (IT50 and IT90, respectively), average Ci during first 300 s of induction (Ci avg), average intrinsic water use efficiency (iWUEavg=Ā300/gs avg), average gs, the maximum A during induction (AMax), A at the end of this period (A300), and the average A (Ā300). A significant R value is marked by a black line on the scale (0.8).

