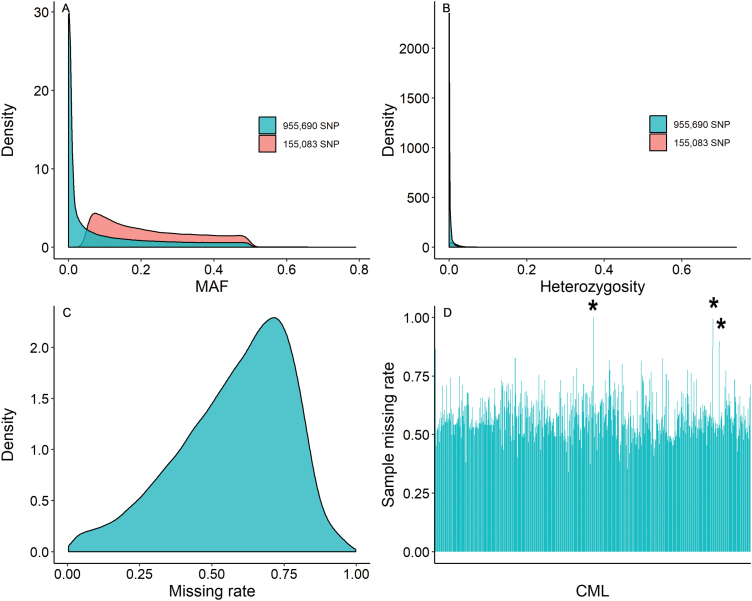
Fig. 1.
Basic information summarized from cGBS genotyping. Two data sets are used: unfiltered (blue) and filtered (pink). (A) SNP minor allele frequency; (B) SNP heterozygosity; (C) overall missing rate for 955 690 SNPs; (D) missing rate for each of the 529 CMLs (in numerical order), where asterisks indicate the three samples deleted from analysis due to high missing rate (i.e. CML342, CML529, and CML539).

