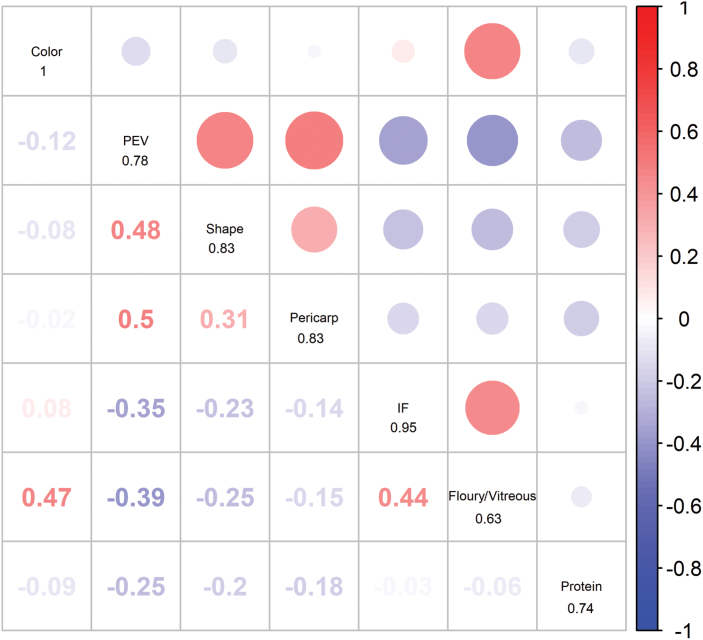
Fig. 2.
The pairwise correlations (Pearson’s r) among the seven traits based on the BLUP values. The value marked under each trait name in the diagonals was the heritability in broad sense for the corresponding trait. Correlations are represented as colored circles, blue indicating negative correlation, and red indicating positive correlation.

