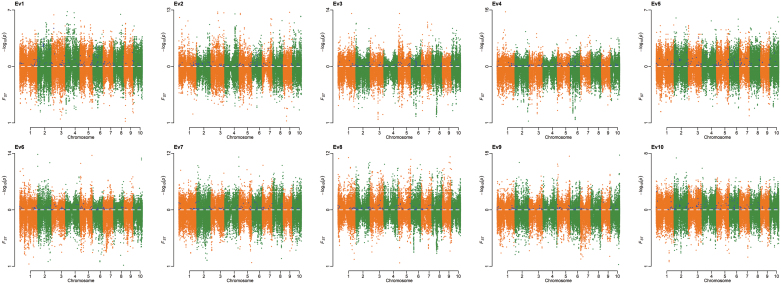
Fig. 5.
Miami plots from EigenGWAS. The upper panels show data for –log(PGC) and lower panels, for Fst for Ev1-Ev10, based on 526 CIMMYT inbred lines with 155 083 SNPs. Dots in blue are associated with seven popping-related traits, with their detailed information listed in Table S5.

