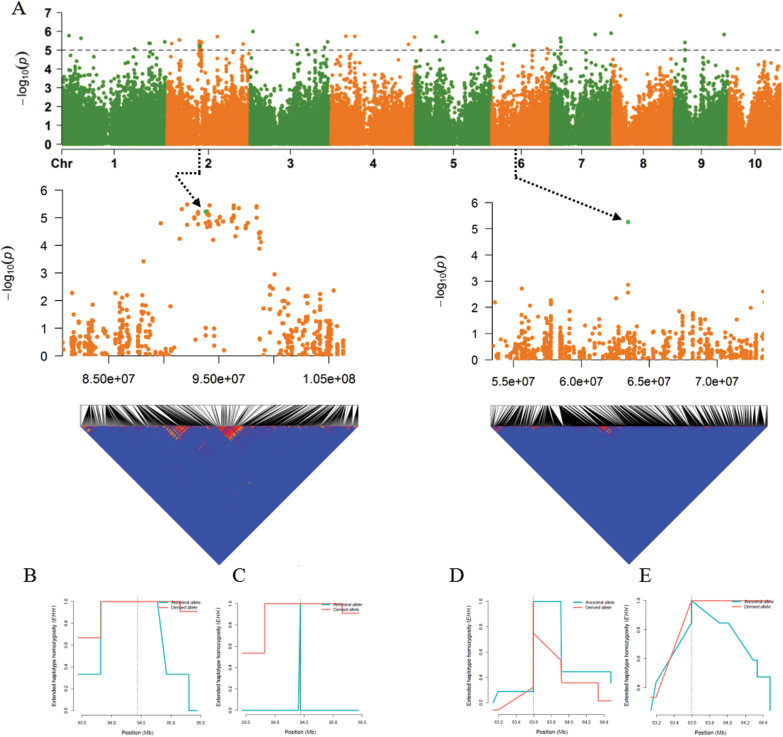
Fig. 8.
Genome-wide Manhattan plot and linkage disequilibrium (LD) blocks. Data are from S2_93806542 in the region from 70 to 90 Mb on chromosome 2, and S6_63434708 in the region from 80 to 100 Mb on chromosome 6. The horizontal grey dashed line indicates genome-wide significant thresholds -log10 (p) value of 5 (A), and EHH (extended haplotype homozygosity) for intervals in the length of 20 Mb with S2_93806542 and S6_63434708 in the middle when selecting 100 lowest PEV (B and D) and 100 highest PEV (C and E) accessions in 764 landrace populations.

