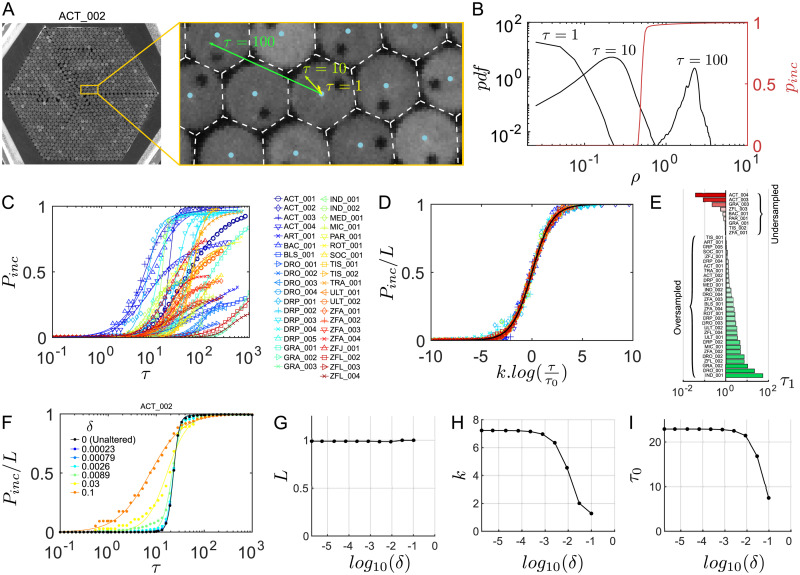
Fig 3. Characterization of the TD2 dataset.
(A) Illustration of the dynamics at various timescales in ACT_002. The Voronoï cells (dashed white) and the displacements of a particle at τ = 1, 10 and 100 are overlaid. (B) Geometric probability of incursion pinc (red) and distribution of the reduced displacement ρ at three different timescales τ (black) in ACT_002. The probability of incursion Pinc is the intersection of the areas under the two curves. (C) Pinc as a function of τ for the whole dataset (symbols). The solid lines are fits with a logistic function (see text). (D) Scaling of the reduced quantities Pinc/L as a function of on the standard logistic sigmoid function (solid black). (E) Classification of the movies in the dataset by increasing values of τ1 as defined by Eq (4), with fitting parameters determined over a logarithmic scale for Pinc. Movies with τ1 < 1 are undersampled while movies with τ1 > 1 are oversampled. (F) Comparison of Pinc(τ) for different levels of degradation δ (symbols) and corresponding logistic fits (solid curves) in ACT_002. (G-I) Evolutions of the fitting parameters L, k and τ0 as a function of the degration δ in ACT_002.

