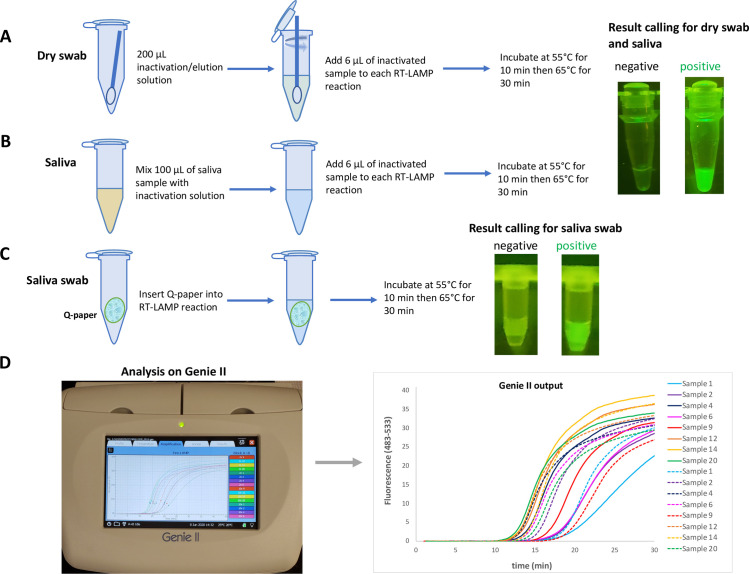
Fig 3. Sampling work-flow and results output.
(A) Dry nasal swabs were used as sampling method. Swabs were first eluted in a sample preparation buffer and aliquot from that was added into RT-LAMP mixture. End-point results were visualized using blue LED and orange filter. (B) Direct saliva was mixed with a sample preparation buffer briefly and aliquot from that was added into RT-LAMP mixture. End-point results were visualized using the same method for nasal swab sampling. (C) Q-paper was combined with saliva and Q-paper coated with saliva was directly introduced into RT-LAMP mixture without further manipulation. End-point fluorescent signal was visualized using blue LED and orange filter. Note that the square of Q-paper is observable, but does not compromise the real-time or end-point analysis. (D) In addition to end-point visualization, RT-LAMP experiments were also run in real-time using Genie® II (Optigene, UK) which can operate on battery therefore enabling its use in low-resource settings.

