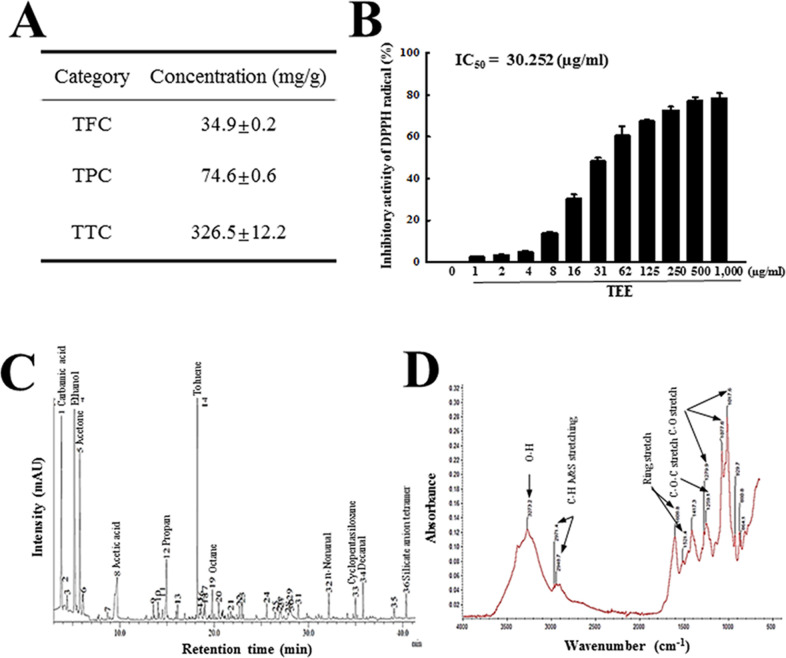
Fig 1. Phytochemical composition and component conformation in TEE.
(A) Total flavonoids, phenols and condensed tannin content were analyzed in mixtures containing different concentrations of TEE. (B) Free radical scavenging activity of TEE. DPPH radical scavenging activity was assayed in a mixture containing 0.1 mM DPPH and varied concentrations of TEE (1–1,000 μg/mL). (C) GC-MS spectra of TEE. Major peak in GC/MC chromatogram indicated the name of component. (D) FTIR spectrum of TEE. The functional group of organic compound indicated into major peak. Three samples were assayed in duplicate by DPPH analysis. The data are reported as the mean ± SD. *, p < 0.05 compared with the No treated group. #, p < 0.05 compared with the Lop+Vehicle treated group. Abbreviations: DPPH, 2,2-diphenyl-1-picrylhydrazyl radical; IC50, half maximum inhibitory concentration.

