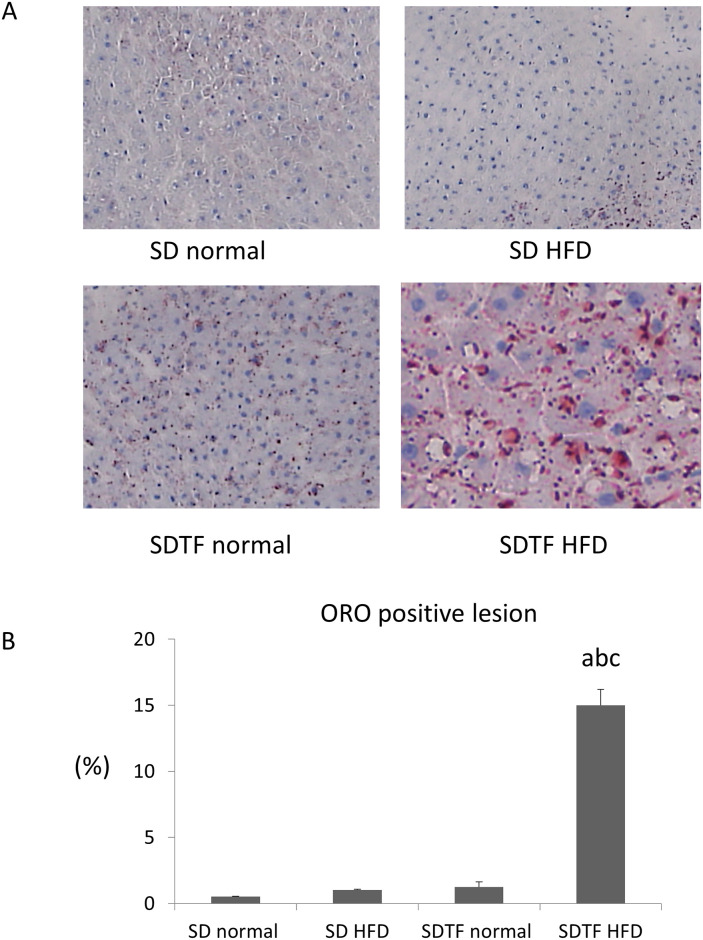
Fig 1. Evaluation of hepatic lipid contents in SD and SDTF rats fed a normal diet and HFD for 12 weeks.
(A) Frozen liver sections were stained with Oil Red O. (B) Quantitative analysis of changes in Oil Red O positive area in respective groups. Data are expressed as means ± SE. (a P < 0.01 compared with normal diet-fed SD rats, b P < 0.01 compared with HFD-fed SD rats, c P < 0.01 compared with normal diet-fed SDTF rats). Original magnification, 100×.

