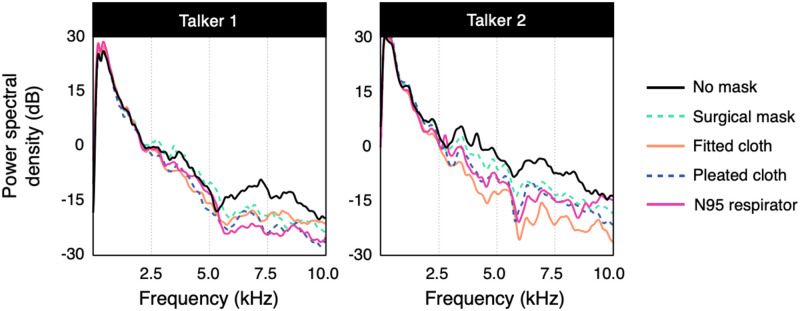
Fig 2. Average spectra of speech sounds produced while wearing each type of mask.
The y-axis indicates the logarithmic power spectral density of the sound. Compared with the no-mask condition, face masks generally attenuated higher frequencies. They also had a greater overall effect for Talker 2, compared with Talker 1.

